
How does a microvolume spectrophotometer
take a measurement?
Understand a reliable measurement through four modules: light source, path length, spectrum and algorithms.
Explore the four modules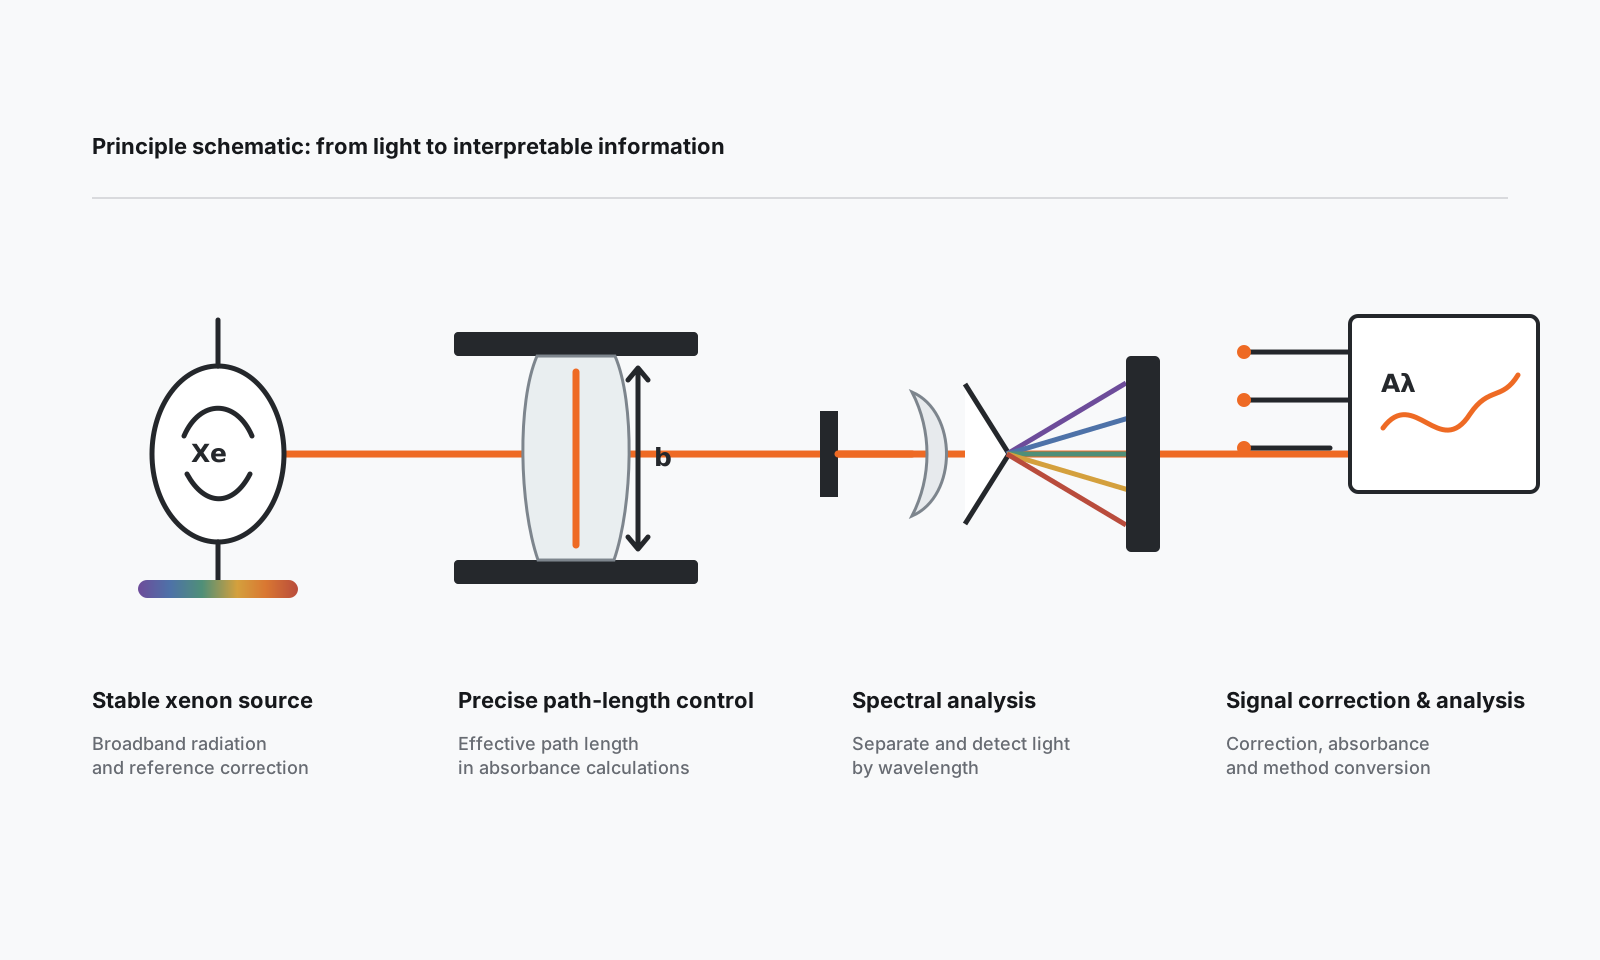
Stable xenon light source
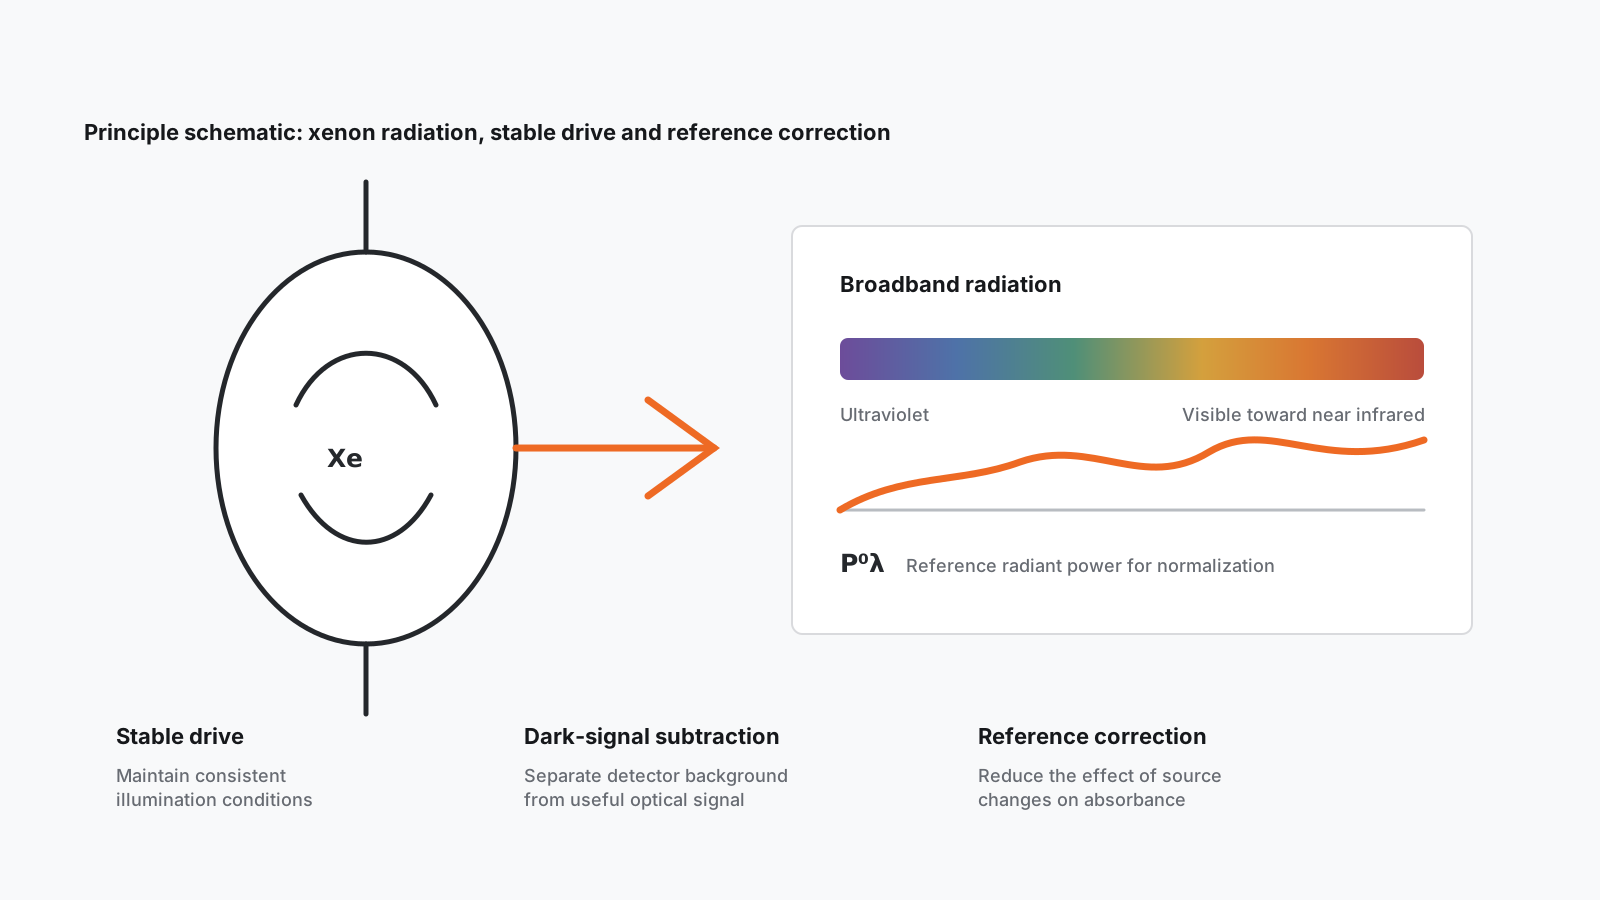
A xenon lamp can provide broadband continuous radiation extending from ultraviolet through visible toward the near infrared. The calculation depends not simply on brightness, but on repeatable reference radiant power at each wavelength that can be corrected.
Precise path-length control
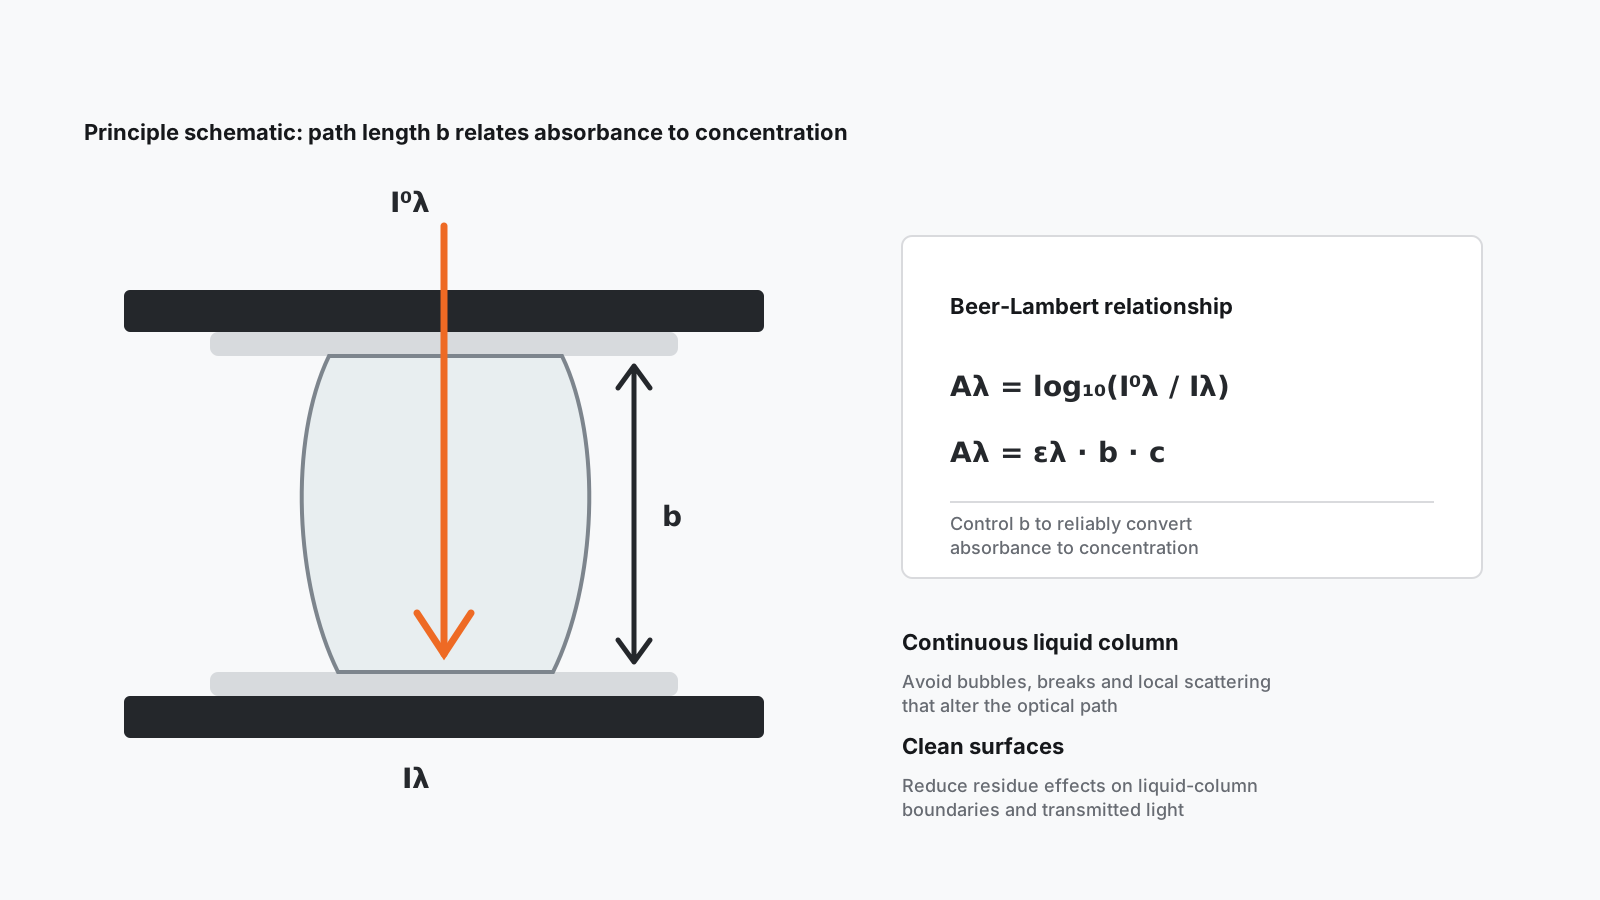
The Beer-Lambert relationship incorporates effective path length b directly into absorbance and concentration calculations. Liquid-column continuity, clean measurement surfaces and a known path length all affect the basis of the calculation.
Spectral analysis
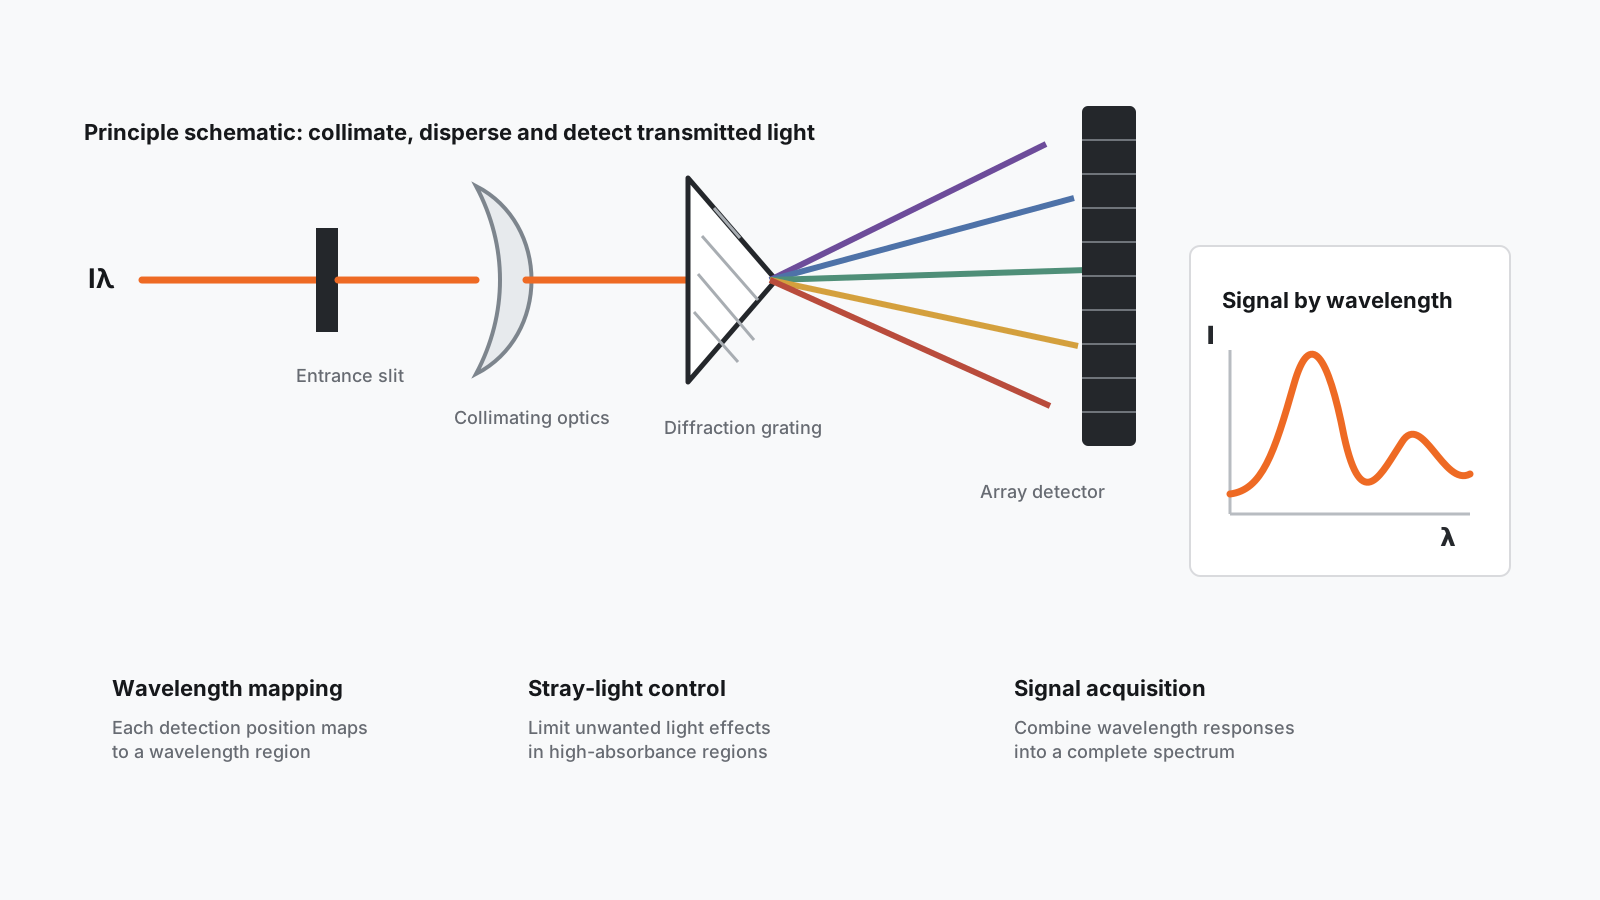
Light transmitted through the sample must pass through input restriction, collimation, dispersion and detection to organize wavelength-dependent responses into a complete spectrum. Analytical capability comes from controlling the entire optical chain, not from the appearance of a curve.
Signal correction & analysis
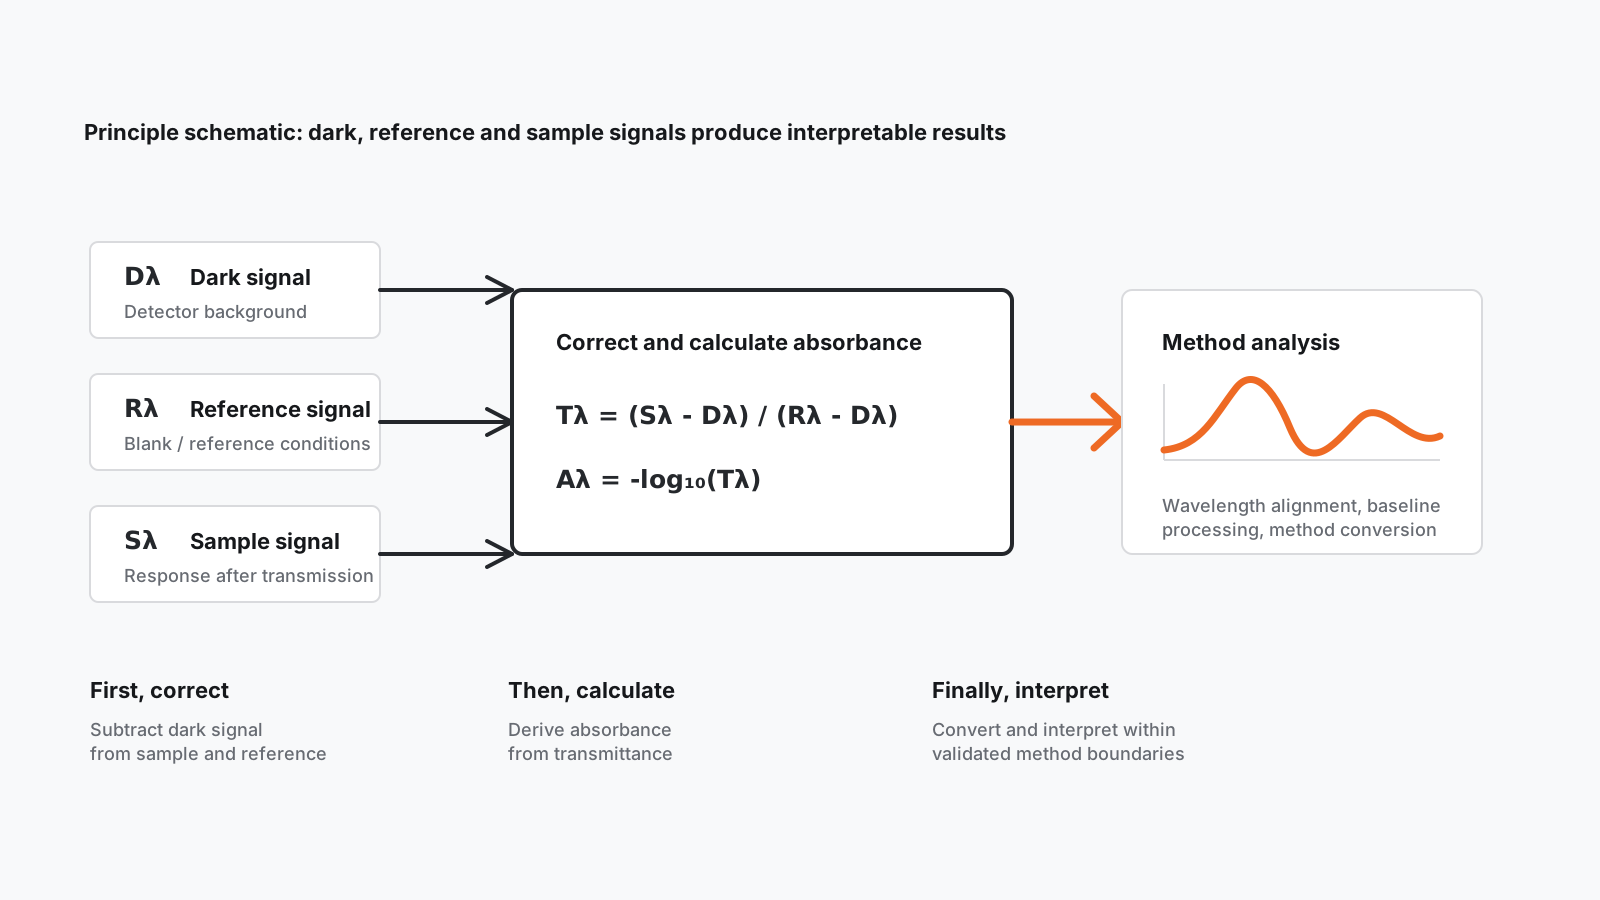
Algorithms first distinguish dark, reference and sample signals, then calculate transmittance and absorbance at each wavelength. Subsequent baseline processing, wavelength alignment and concentration conversion must remain within validated method boundaries.
Now explore NANO X1.
One product platform, four configurations. Choose the measurement capabilities you need.
View NANO X1- NANO X1 Standard
- Nucleic acid concentration, protein concentration, UV-VIS
- NANO X1F Fluorescence
- Standard capabilities + fluorescence detection
- NANO X1C Cuvette
- Standard capabilities + kinetics analysis, OD600
- NANO X1CF Fluorescence + Cuvette
- All measurement capabilities