
Why can absorbance measured at a short path length be converted to a 10 mm equivalent value?
The same sample has an absorbance of 0.6 at a short path length, yet the report shows a 10 mm equivalent absorbance of 12. Does this 20-fold difference mean that the measurement is abnormal?
First check the path length associated with each number. If 0.6 was measured at an effective path length of 0.5 mm, and the sample meets the conditions under which absorbance is proportional to path length, its 10 mm equivalent value is 12. This changes the reference path length used to express the result; the sample concentration has not increased 20-fold.
Understanding this distinction helps when reading results from a microvolume spectrophotometer and comparing measurement modes. It also prevents a high equivalent absorbance from being mistaken for an equally high absorbance measured directly by the detector.
1 Distinguish the measurement path length from the reporting path length
The measurement path length is the effective distance that light travels through the sample. The reporting path length is the length used as a common reference for expressing results. A 10 mm equivalent absorbance is a value scaled to 10 mm in proportion to path length; it does not mean that a 10 mm sample cell was necessarily used for that measurement.
At a specified wavelength, for a homogeneous sample whose absorption properties remain unchanged and under conditions where the Beer–Lambert law applies, absorbance is proportional to concentration and path length:
A=εcl
Here, A is absorbance, ε is the molar absorption coefficient at that wavelength, c is amount-of-substance concentration, and l is path length. The coefficient, concentration, and path length must use compatible units; for example, if ε is expressed in L·mol⁻¹·cm⁻¹, l must be expressed in cm.
For the same sample, changing only the path length gives:
A₁₀=Aₗ×10 mm÷l
Aₗ is absorbance at the measurement path length l, and A₁₀ is the 10 mm equivalent absorbance. If the numerical value of l is expressed in mm, the conversion factor is 10÷l. Since 10 mm and 1 cm are the same length, do not multiply by another factor of 10 when switching between them.
2 An equivalent absorbance of 12 does not mean that the measured transmittance is 10⁻¹²
Consider an idealized sample used for teaching, with a 10 mm equivalent absorbance of 12 at a given wavelength. Keeping its concentration unchanged and using path lengths of 1.0, 0.5, and 0.2 mm gives absorbances of 1.20, 0.60, and 0.24, respectively. All three convert to 12.
Decadic absorbance and transmittance are related by:
T=10⁻ᴬ
Here, A must correspond to the measurement path length being considered, and T is a transmittance fraction relative to the reference conditions, not the fraction of the light source's total output power received by the detector. Expressed as a percentage, transmittance is 100×10⁻ᴬ%. The ideal transmittances for the three path lengths above are therefore approximately 6.31%, 25.12%, and 57.54%.
If the instrument used a 0.5 mm path length, 0.60 is the absorbance relevant to that transmission measurement. Substituting the equivalent value of 12 directly into the equation gives the transmittance at a 10 mm path length in the ideal model; it does not establish that the detector received a transmitted fraction of only 10⁻¹² in the actual measurement.
These numbers are calculated from the equations to explain path-length conversion. They are not instrument measurements and do not validate the measurement range of any particular model.
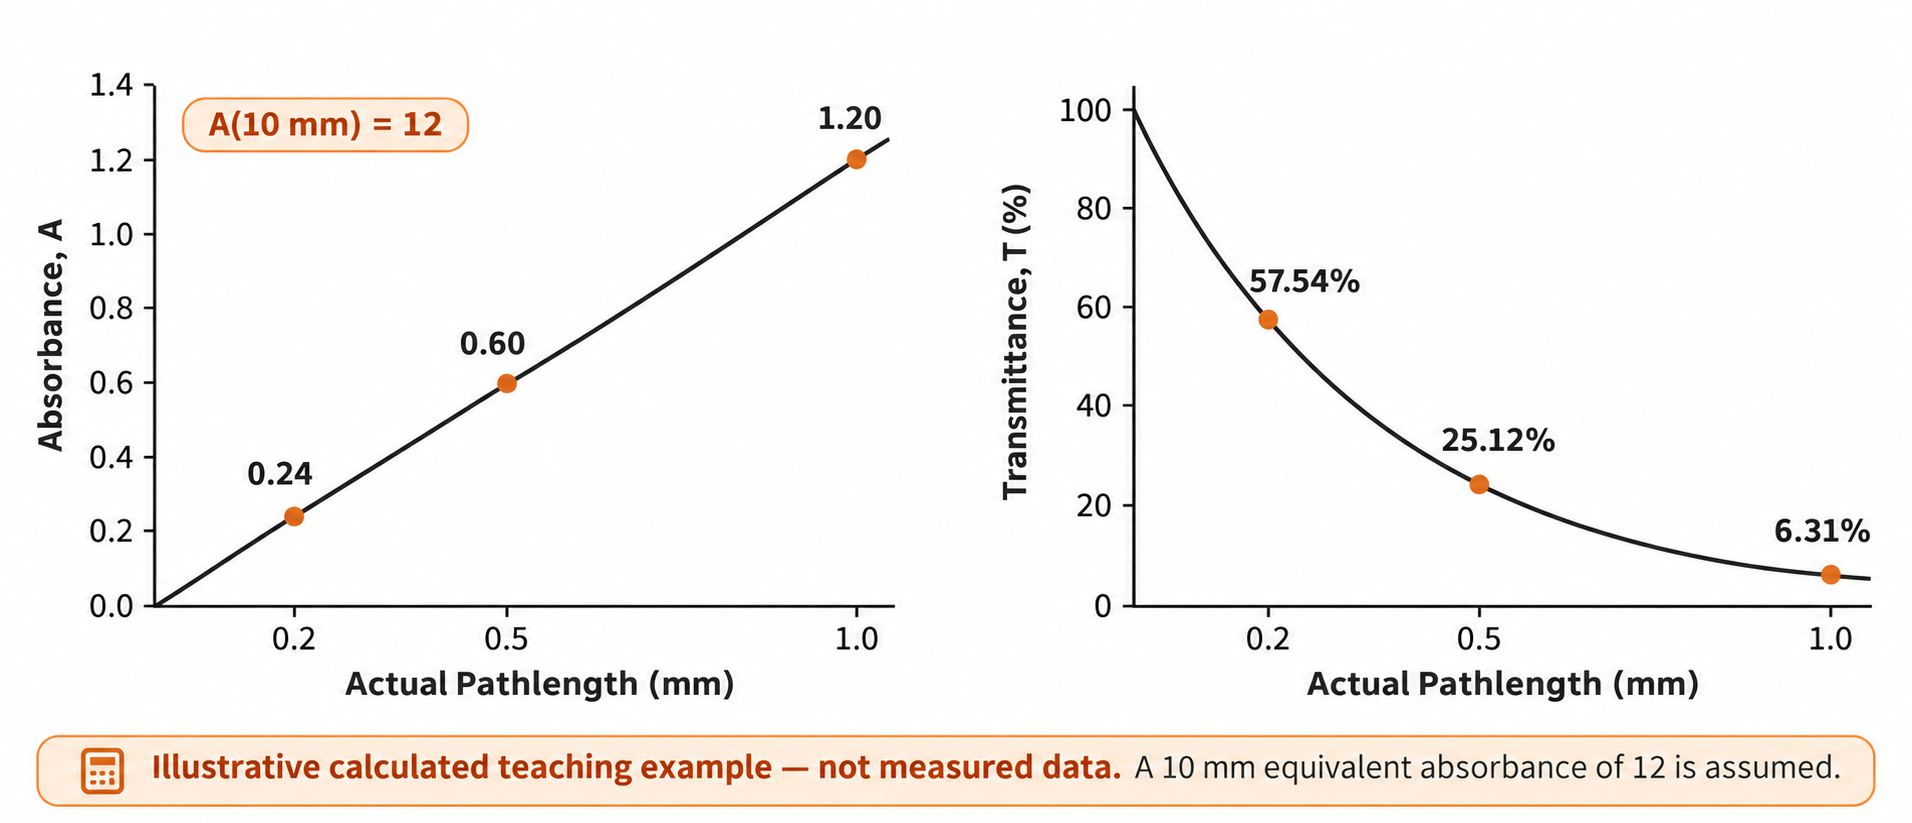
Figure 1. Absorbance and transmittance of the same sample at different path lengths. The ideal model assumes a 10 mm equivalent absorbance of 12. Measurement path lengths of 1.0, 0.5, and 0.2 mm correspond to absorbances of 1.20, 0.60, and 0.24, and transmittances of approximately 6.31%, 25.12%, and 57.54%, respectively. All three absorbances normalize to 12. The curves are drawn from equations, not measured data.
3 Why a short path length helps with concentrated samples
For the same sample and wavelength, shortening the path length reduces absorbance and increases the transmitted fraction of light, making it easier for a sample with a very weak transmitted signal to fall within the instrument's applicable measurement range. This is one reason why microvolume measurements can reduce the need to dilute some highly concentrated samples.
At high absorbance, the useful transmitted signal can be very weak, so stray light and other sources of error require particular attention. For example, stray light that is not absorbed by the sample can cause absorbance to be underestimated. Scaling an already underestimated result by the path-length factor cannot restore the lost accuracy.
Nor does a shorter path length always mean a better measurement. For a dilute sample, shortening the path length further reduces the change in absorbance. With other conditions comparable, a very small absorption signal can be harder to distinguish from baseline fluctuations. Select the path length according to sample concentration, wavelength, and the validated ranges of the instrument and method, rather than always using the shortest available path length.
4 What path-length normalization cannot correct
Path-length conversion depends on a reliable effective path length, a suitable sample state, and a dependable original signal. The following issues need to be addressed first; they cannot be eliminated simply by multiplying by a conversion factor:
- The effective path length differs from the path length used in the calculation. A discontinuous liquid column, bubbles, or an abnormal measurement-surface condition can disrupt the intended measurement conditions.
- The sample is turbid or contains particles. A reduction in transmitted light can include contributions from scattering and should not automatically be attributed entirely to molecular absorption by the target analyte.
- A change in concentration is accompanied by a change in chemical state. If dilution causes dissociation, association, or other equilibrium changes, the response may no longer scale directly with concentration.
- The measured signal is outside the reliable measurement range. Saturation, insufficient transmitted signal, or an abnormal baseline will not disappear merely because a result is converted to a 10 mm equivalent value.
For a sample that meets the model's assumptions, if results measured at different path lengths remain substantially different after normalization, first retain the original spectra and measurement conditions and investigate the sample, path length, and signal. Do not simply average the results to conceal the differences.
5 Four checks before comparing results
First, confirm which form of absorbance is displayed. Values at the measurement path length, 10 mm equivalent values, and other normalized results need separate labels. Consult the reporting documentation rather than judging by the size of a number alone.
Second, confirm that the comparison uses the same wavelength, the same sample state, and comparable blank and processing conditions. Expressing all results at 10 mm removes only differences in the path-length reference; it does not make other experimental conditions equivalent.
Third, treat path-length conversion and dilution factors separately. Shortening the path length does not reduce sample concentration; dilution does. If the software has already calculated concentration using the measurement path length, do not manually apply the path-length factor again. Separately check whether the sample was diluted and whether the software has already included that dilution factor.
Fourth, confirm that results fall within the valid range for the relevant mode. Do not treat a 10 mm equivalent range specified for short-path measurements as the range that can be measured directly in a 10 mm cuvette.
The Evolstorm NANO X1 is used for microvolume measurements of nucleic acids, proteins, and routine UV-VIS samples, and its product documentation specifies absorbance range as 10 mm equivalent values. When reading these specifications or comparing experimental results, consider both the measurement path length and the reporting reference. Follow the instructions for the configuration and software version in use.
A record that supports review should include measurement wavelength, measurement mode, measurement path length, absorbance reference, dilution factor, and the complete spectrum. Retaining these details alongside the concentration result helps determine whether a difference comes from the sample, the measurement conditions, or different ways of expressing the same result.