
Why can OD600 not be directly converted to a viable bacterial count?
From light scattering and dilution back-calculation to comparisons across instruments
The same bacterial suspension may give different OD600 readings on different spectrophotometers. Diluting a concentrated suspension and multiplying by the dilution factor may also give a result higher than the direct reading of the undiluted sample. Neither difference alone establishes that an instrument is inaccurate. To interpret the results, first distinguish three quantities: the OD600 read by the instrument, the OD600 back-calculated from a dilution, and the cell count or colony-forming units obtained by an independent method.
OD600 primarily records light attenuation
OD600 is the optical density measured at 600 nm. It is usually calculated from the ratio of the transmitted signal to that of a matched blank:
OD600 = −log₁₀(T), where T is the transmittance relative to the blank.
For common bacterial suspensions that are not strongly colored, light attenuation is mainly caused by scattering from cells. An absorption coefficient for a particular molecule in solution cannot simply be applied. Cell size, shape and aggregation, as well as absorption by the culture medium or pigments, can all affect the reading. OD600 is therefore useful for tracking culture turbidity under defined conditions, but it is not a direct count of individual cells by the instrument.
When cells are sufficiently dilute and well dispersed, and the measurement geometry is appropriate, OD600 can be approximately proportional to cell concentration. At higher densities, multiple scattering changes the amount of light reaching the detector, and proportionality may no longer hold. The fact that an instrument still displays a number does not establish that the reading remains proportional to cell count.
The same path length does not guarantee the same readings on two instruments
A detector receives directly transmitted light and may also collect some scattered light. With other conditions held constant and each system normalized to its own matched blank, an optical system that collects more scattered light may report a lower OD600. Differences in aperture, collection angle and optical layout can all affect the result.
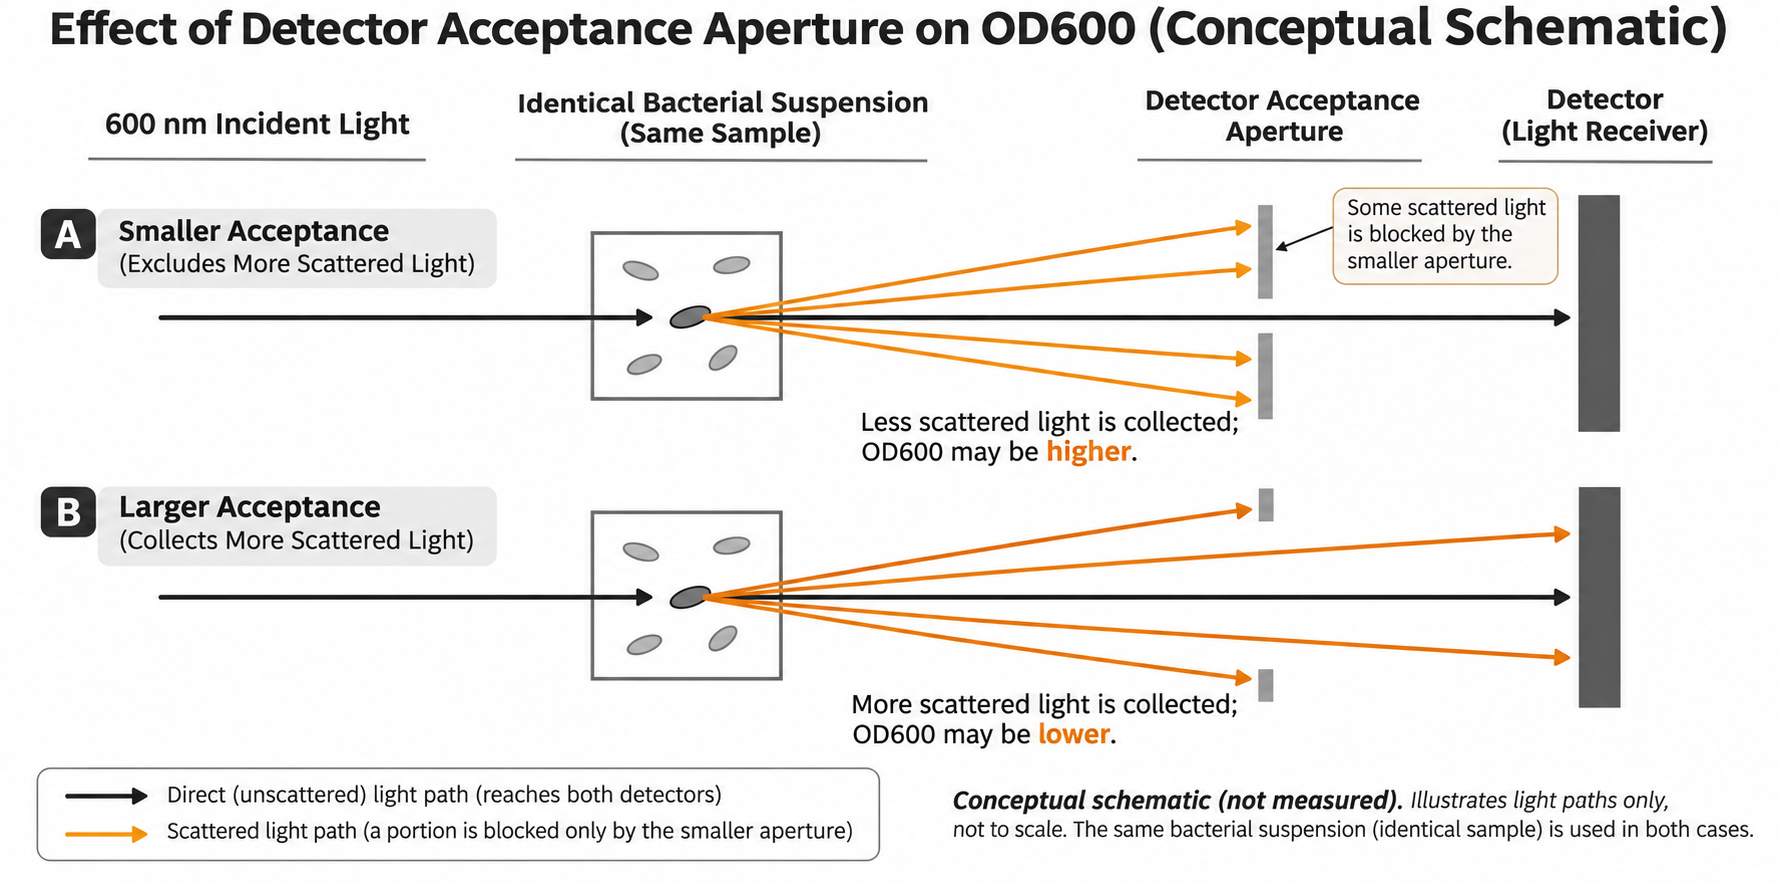
Figure 1 | How the light-collection range affects OD600. Black arrows indicate directly transmitted light, and orange arrows indicate scattered light. In this schematic, the wider collection range admits more scattered light. This is a teaching schematic, not experimental data, and does not represent the specific optical design of any brand.
Consequently, converting both results to a “1 cm path length” does not automatically eliminate instrument-dependent differences in scattering measurements. Results from cuvette, microplate and microvolume configurations should not be assumed equivalent solely on the basis of a path-length ratio. For comparisons across devices, use the same set of representative samples to establish and validate a relationship within the applicable range of each configuration.
The conditions for dilution back-calculation matter more than the multiplication itself
For concentrated bacterial suspensions, a reasonable approach is to dilute first so that the reading falls within a linear range validated for that suspension, instrument and measurement configuration, and then calculate the back-calculated value. There is no single upper OD600 limit that applies to all strains and devices. A manufacturer-specified operating range should also be checked with the samples concerned.
Provided that matched blanks are used, the path length and configuration are kept consistent, and dilution has not substantially changed cell state or aggregation:
Dilution factor D = total volume after dilution ÷ volume of the original sample taken
Dilution-back-calculated OD600 of the original sample = net OD600 after dilution × D
“Net OD600” is the result after correction for the matched blank. If the software has already performed the dilution back-calculation, do not multiply again. Retain the measured net reading and dilution factor in the records, rather than keeping only the final back-calculated value.
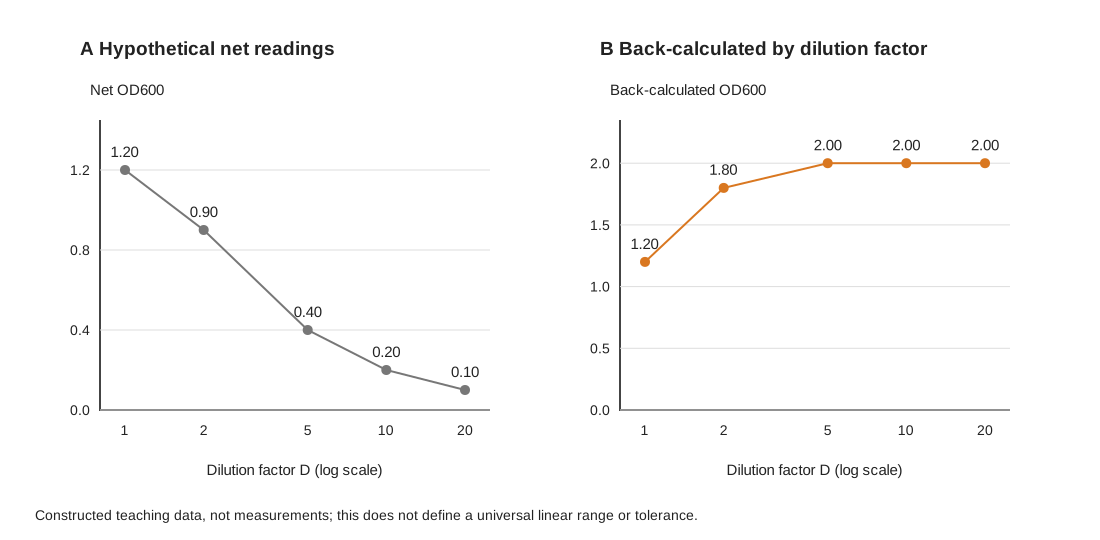
Figure 2 | Checking back-calculation consistency at different dilutions. All values are constructed teaching examples, not experimental data. The region of agreement shown is neither a universal linear range nor an acceptance threshold. Each back-calculated value is calculated as “net OD600 × dilution factor.”
In Figure 2, the hypothetical net readings at dilution factors of 5, 10 and 20 are 0.40, 0.20 and 0.10, respectively, each giving a back-calculated value of 2.00, whereas the direct reading of the undiluted sample is only 1.20. This difference can suggest a departure from proportionality in the more concentrated sample. However, the figure alone cannot rule out problems with the blank, pipetting or mixing, or sample changes caused by dilution.
A dilution series helps identify a region in which back-calculated results converge within the error permitted by the method, with independent replicates used for verification. Further dilution until the signal approaches the background may increase relative error again. Do not select only favorable points to make the results agree, or simply average the back-calculated results from all dilutions.
Two concepts must also be distinguished: the back-calculated value of 2.00 is an equivalent reading extrapolated from the linear range after dilution. It does not require the instrument to display 2.00 when directly measuring the undiluted sample, and it does not establish how many cells are present per milliliter.
To convert OD600 to a cell count, first define what is being counted
If the aim is to assess culture progress within the same workflow, validated OD600 measurements can serve as a convenient process indicator. To report cells/mL, CFU/mL or dry weight, establish a conversion relationship using the corresponding independent measurement. A generic factor found online is no substitute.
Total cell count and CFU are different quantities. Microscopic counting or an appropriate cell-counting method records the cells included in the count. CFU obtained by plate counting represents units capable of forming colonies under the specified culture conditions. A cell cluster may form one colony, and some cells may fail to produce visible colonies under the conditions chosen. CFU/mL should therefore not be relabeled as “all viable cells/mL.”
OD600 does not distinguish live cells from dead cells. Dead cells that retain the ability to scatter light, as well as cell debris, can contribute to the signal. Following stress or treatment, unchanged OD600 does not establish that the number of culturable cells is unchanged. A decrease in OD600 alone does not demonstrate the bactericidal effect of a treatment either.
When conversion from OD600 to CFU/mL is required, perform paired measurements on the same samples, ensure that calibration covers the intended culture stages and numerical range, and validate it with independent samples. After substantial changes in strain, culture conditions, morphology or aggregation, reassess whether the original relationship remains applicable. Having the “same species name” or “using the same instrument” alone does not guarantee that an old conversion factor remains valid.
Keep these conditions consistent to make growth curves comparable
Keep the measurement configuration consistent. Where possible, use the same instrument, container type, path length and readout settings. For microplate measurements, also record the plate type and volume per well. After changing these conditions, validate comparability before combining data.
Control sampling and background. Mix thoroughly and consistently before sampling, and check for settling, aggregation, bubbles and container contamination before taking a reading. Use a blank that matches the liquid phase being measured and a suitable diluent. If the color or composition of the liquid phase changes during culture, assess whether the background is still matched rather than continuing to use the initial reference.
Retain the complete calculation chain. At each time point, record the sampling time, measured blank-corrected OD600, dilution factor, any path-length adjustment and final back-calculated value. Distinguish replicate measurements using newly collected samples from successive readings of the same sample; the latter do not capture sampling and solution-preparation errors.
Interpret the curve in relation to the question being asked. A flattening curve may reflect changes in growth, but it may also result from measurement nonlinearity, settling or morphological changes. Confirm that readings remain within the applicable range before discussing growth rate. If the question concerns changes in culturable numbers, include corresponding CFU measurements rather than relying on turbidity alone.
OD600 is valuable for rapidly tracking optical changes in a culture over time. Clearly defining the measurement conditions, linear range and what is being counted makes this convenient measurement a credible basis for interpreting an experiment.
Related products and applications
For experiments that require tracking changes in bacterial suspension turbidity, the X1C and X1CF configurations in the Evolstorm NANO X1 series provide cuvette-based OD600 measurement. Keep measurement conditions consistent, confirm the applicable dilution range, and retain measured readings and back-calculation records. To obtain CFU/mL, perform separate paired counts and calibration; OD600 readings must not be treated directly as viable bacterial counts.