
How should microvolume measurement repeatability be assessed?
When the same sample is measured several times, how much variation warrants attention? The coefficient of variation (CV) summarizes relative dispersion within a set of results, but a percentage alone cannot reveal the source of error or demonstrate accuracy. First define the repeated steps, then calculate the mean, sample standard deviation and CV from all individual results, and interpret them in the context of the conditions and intended use.
First define what is repeated
Repeated readings without removing the same drop primarily observe variation under that single loading condition and exclude the variation from re-aspiration and reloading. Taking a fresh aliquot from the same mixed sample and reloading each time includes those operations. Extracting, diluting or preparing a sample anew for each measurement extends the assessment to preparation. These designs answer different questions; CVs cannot be compared directly merely because all are called repeat measurements.
This article considers repeatability when the same sample is reloaded on the same day by one operator, with one instrument and method. This is not intermediate precision across days or operators, and does not independently represent the precision of the complete sample-preparation process. Record these boundaries to avoid applying a narrow result to a broader quality judgment.
Calculate CV from individual results
Let the valid individual concentrations be x₁ through xₙ, the mean be x̄ and the sample standard deviation be s. For concentration data with a positive mean, percentage CV is commonly calculated as shown below. The denominator for sample standard deviation is n−1, not n. Before calculation, ensure all results use the same units and the same treatment of dilution factors.
x̄ = (x₁ + ⋯ + xₙ) / n
s = √[Σᵢ₌₁ⁿ (xᵢ − x̄)² / (n − 1)]
CV (%) = s / x̄ × 100%
For example, three independent reloads yield 49, 50 and 51 ng/µL, with a mean of 50 ng/µL. Their deviations from the mean are −1, 0 and 1; the sum of squares is 2. Dividing by n−1 = 2 and taking the square root gives s = 1 ng/µL, so CV = 1 ÷ 50 × 100% = 2.00%. These numbers are teaching examples, not instrument measurements; three observations do not establish that three are sufficient for performance acceptance.
Do not substitute the standard error of the mean (SEM) for standard deviation when reporting repeatability. Standard deviation describes the dispersion of individual results. Under appropriate assumptions including independent repeats, the standard error of the mean is the sample standard deviation divided by the square root of the repeat count, and describes variation in the estimated mean. Using standard error to calculate a ‘CV’ makes it appear smaller as repeats increase while changing what is being assessed.
A low CV does not prove accuracy
Precision concerns how close results are under specified conditions; trueness concerns systematic error. A stable blank offset or a consistently incorrect conversion can shift all results in the same direction without causing large relative dispersion. Good repeatability and accuracy are different judgments.
Figure 1 places a second teaching set, 59, 60 and 61 ng/µL, on the same scale as the previous example. Both sets have a sample standard deviation of 1 ng/µL, but the second has a lower CV of 1.67% because its mean is higher. If the reference is assumed to be 50 ng/µL, its mean is nevertheless 20% higher. The example shows only that low CV cannot exclude an overall offset; it is not a calibration acceptance criterion. Real assessment also needs an appropriate reference and its uncertainty.
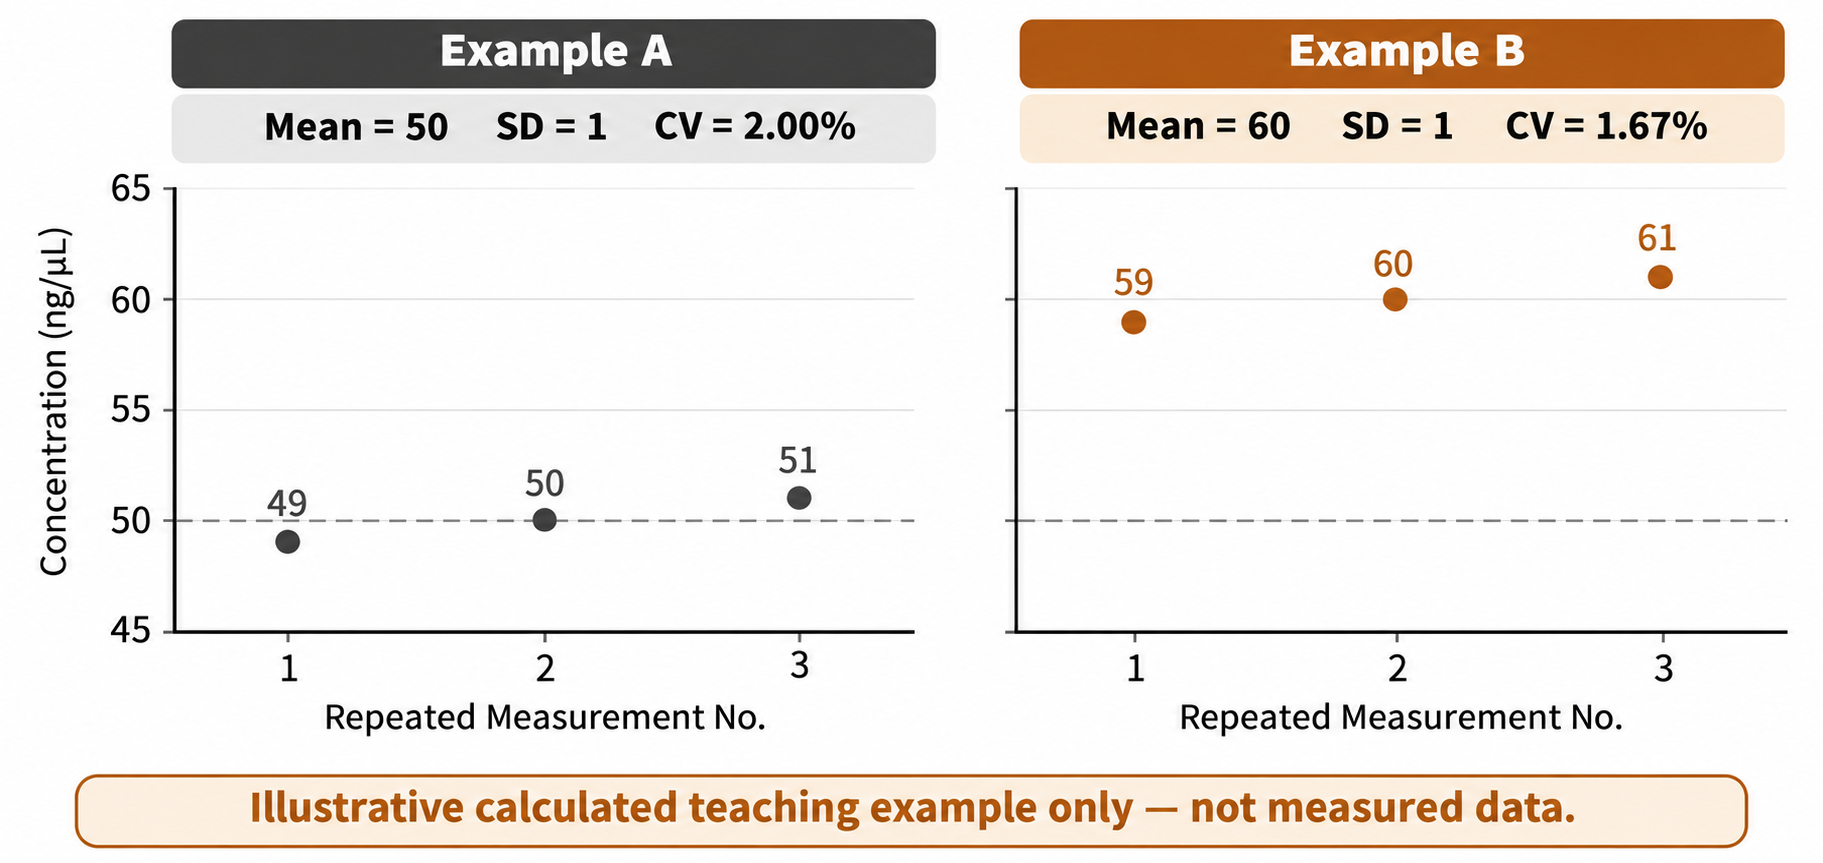
Figure 1. Lower relative dispersion does not imply closer agreement with a reference. Both sets are original mathematical examples, n = 3. The dashed reference value is hypothetical, not measured data or a product-performance or calibration conclusion.
How to judge whether the results are acceptable
There is no universal ‘CV below 1%’ or ‘CV below 5%’ threshold for all microvolume samples and purposes. Define acceptance requirements before measurement based on sample type, concentration range, method capability and downstream use, rather than choosing an easy threshold after seeing the results. A CV from a short sequence is an estimate under those conditions and cannot replace method validation across relevant concentrations and routine conditions. To compare two operations, use similar samples, comparable concentrations and consistent repeat designs, changing only the step under study where practicable. If one set repeats the same drop and the other reloads, the CV difference combines design differences and cannot establish that one instrument is more stable.
Review CV together with the mean and standard deviation. When the mean approaches zero, a small change in the denominator can make CV fluctuate markedly. Do not rank results on percentage alone or attribute CV differences across concentrations directly to instrument performance. Examine absolute variation and the method’s applicable range as well.
Control conditions before investigating differences
Before measurement, define repeat count and rules for handling anomalies, and fix sample mode, conversion parameters, blank conditions and dilution factors. Select a matrix-matched blank and confirm the sample is within the applicable range. Mix appropriately for that sample to avoid taking a stratified or nonhomogeneous portion; use a fresh tip for each aliquot and watch for bubbles. Follow the relevant model and version instructions for loading volume, surface cleaning and handling between measurements; do not copy settings from another product.
Retain the individual raw values and examine them in measurement order. Even with the same mean and CV, random fluctuation and a sustained rise may call for different investigations. If a trend appears, consult records for mixing, waiting time, evaporation, residue, blank or setting changes; the trend alone cannot identify its cause. Do not keep adding observations until CV falls or delete an inconvenient point to lower it. If a specific operating error is confirmed, retain the original record, document the reason and apply predetermined rules for exclusion or remeasurement.
Make repeatability results traceable
A reviewable record should include sample and blank information, date, operator, instrument and software versions, mode and dilution factors, repeat design, planned count, all individual values in order, mean, sample standard deviation, CV and any anomaly handling. This gives a basis for investigating a large CV rather than leaving an isolated percentage without context.
Evolstorm provides instruments and application knowledge for optical measurement. When using NANO X1 for microvolume measurements, follow the instructions for the relevant model and version. For technical discussion, providing sample and blank details, original individual results, and instrument and software versions is more useful than reporting only ‘poor repeatability’ or one CV value.