
Why can nucleic acid purity ratios become unreliable at low concentrations?
At low nucleic acid concentrations, the same sample’s A260/A280 ratio may vary above and below the expected value. Do not immediately label it contaminated or purify it repeatedly just to bring the number close to 1.8. First establish whether the absorbances used in the ratio are reliable enough, then assess suitability for the next experiment.
This article addresses interpretation and checking of ratios under low-absorbance conditions; it does not prescribe a concentration cutoff for all instruments. An instrument’s ability to display concentration does not mean it can assess purity reliably under the same conditions.
A ratio is not another independent measurement
A260/A280 is the quotient of absorbances at 260 nm and 280 nm after blanking and any applicable baseline correction. It has no units and is generally used to flag possible impurities in nucleic acid samples, not identify or quantify a contaminant directly.
Let the two absorbances be A and B, with R = A/B. If the readings contain small deviations δA and δB, the calculated value is R′ = (A + δA)/(B + δB). The smaller B is, the more the same absolute deviation can change the ratio. This instability becomes especially apparent near zero.
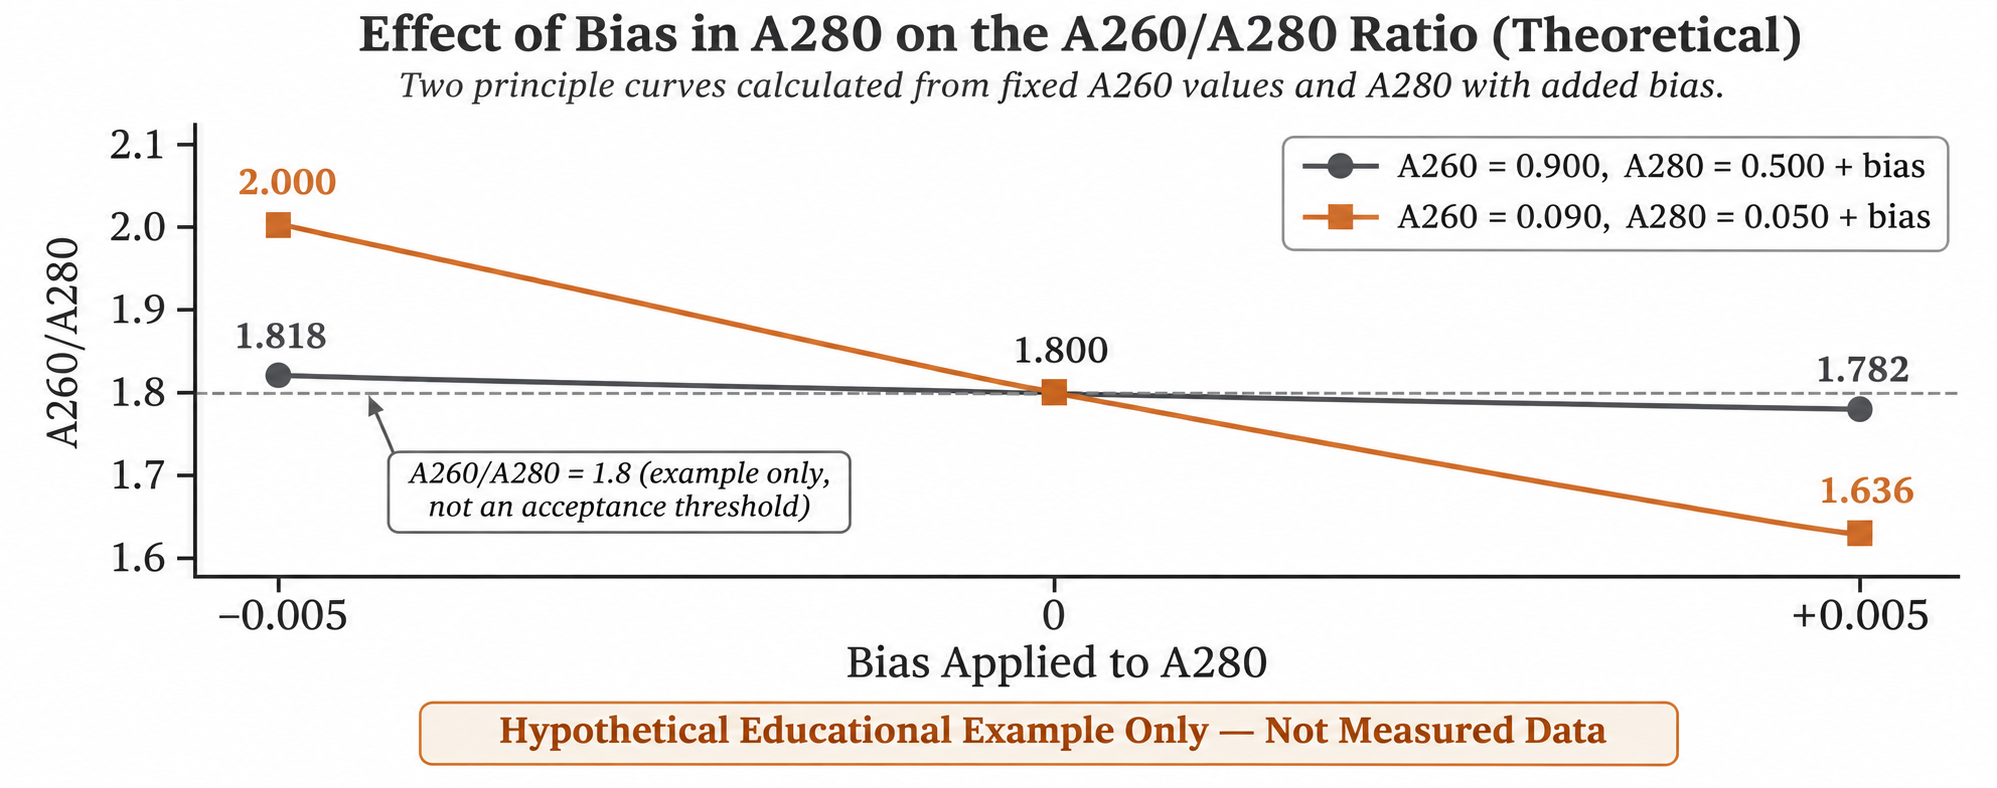
Figure 1. Effect of a denominator deviation on a ratio. The true ratio is assumed to be 1.80, with A260 held constant and A280 varied by ±0.005. Absorbances are 10 mm equivalents. All values are mathematical illustrations, not experimental data or precision specifications for any instrument.
In this illustration, when A280 = 0.500 and A260 = 0.900, the ratio is approximately 1.78–1.82. If both values are reduced tenfold to A280 = 0.050 and A260 = 0.090, the same denominator deviation changes the ratio to approximately 1.64–2.00. The assumed composition has not changed; the sensitivity of a small signal to deviation has.
A higher ratio does not necessarily mean greater purity; a lower ratio alone cannot identify a contaminant
In a real measurement, both wavelengths can be affected and their deviations may be correlated. If both absorbances change by the same proportion, the ratio can even remain unchanged. A stable ratio therefore does not prove accurate concentration, and an unusual ratio does not automatically mean contamination. The one-variable illustration explains the mechanism; it cannot be used to calculate a real instrument’s uncertainty.
A denominator close to zero has another misleading consequence: a small reading change can make the ratio rise sharply or become negative when the denominator crosses zero. Such a result should not be treated as an ordinary purity indicator, nor should the measurement closest to an ‘ideal’ value be selected for reporting.

Figure 2. Mathematical relationship with A260 fixed at 0.090: R = 0.090/A280. The curve becomes steeper as A280 approaches zero; the ratio is undefined at zero. Only positive denominators are shown. Dashed lines mark the example point, not an acceptance range.
The commonly cited values of approximately 1.8 for DNA and 2.0 for RNA are conditional empirical references, not universal release limits. Solution conditions, sample composition and measurement reliability affect interpretation. A ratio near a reference value does not by itself establish nucleic acid integrity, absence of inhibitors or downstream success.
Inspect absorbances before planning a check
First preserve the original information. Record A260, A280, A230, concentration, the complete spectrum and the blank used, and indicate whether absorbances are path-length equivalents. If the software provides baseline correction, retain its setting so results processed differently are not inadvertently compared.
Examine the magnitudes and repeatability of both absorbances, not just the decimal places of their quotient. If the denominator is comparable to background variation under the current conditions, treat the ratio as having limited interpretability. Base that judgment on the instrument, mode and laboratory validation, not another model’s threshold.
Use a limited repeat to answer a specific question
Next check operating factors that can create misleading results. Confirm that the blank matches the sample solvent, inspect and clean the measurement surfaces according to the instrument’s instructions, and repeat using a fresh aliquot, with attention to mixing, bubbles and consistent loading. The purpose is to assess stability, not to keep measuring until a ‘satisfactory’ ratio appears.
A small number of independent reloads may be arranged first, retaining every reading. If absorbances and spectral shape remain unstable, address the measurement issue first. If absorbance is low and the ratio varies widely, first question whether the ratio is interpretable. If readings are stable, signal is adequate and the spectrum remains abnormal, consider possible impurities in light of the extraction process. A single ratio cannot reliably identify a contaminant.
Do not treat further dilution as a universal remedy for low signal. Under linear conditions at the same path length, dilution reduces absorbance. It may mitigate some interference while making the ratio harder to interpret. Decisions to concentrate, purify or change measurement mode should also consider sample loss, background changes and the amount needed downstream.
Base release decisions on the experimental purpose
If the question is how much target nucleic acid to add, cross-check with a validated quantification method suited to the target type and concentration range. If the question is whether the sample can be amplified, used for library preparation or another reaction, use quality-control methods accepted by that downstream workflow. Concentration, integrity and reaction compatibility answer separate questions; one ratio cannot answer them all.
A record might state: ‘Absorbance was low, limiting interpretation of the purity ratio; contamination was not judged from a single ratio, and further checks follow the quality requirements of the intended application.’ This is more informative than a red or green number alone and explains to others why the experiment continued or the sample was reprocessed.
Applying these judgments in an Evolstorm nucleic acid workflow
Evolstorm NANO X1 product information lists nucleic acid concentration and UV-Vis measurement applications. Read concentration, absorbances and spectrum together in such workflows rather than treating one purity ratio as a sample-release decision. Consult the relevant configuration and version for the model’s valid measurement range, software interpretation and operating conditions.
For a low-concentration sample, the priority is to establish what the available signal can support and obtain the evidence needed for the quality questions that matter to the next experiment.