
Why does A260 of fluorescently labeled nucleic acid require correction?
After a fluorescent probe is reconstituted, reading its concentration in a standard nucleic acid mode can give a high result. One reason is that not all absorbance at 260 nm necessarily comes from nucleic acid: the attached dye can also contribute. This article considers purified fluorescently labeled nucleic acids and how to handle that contribution. The key is to match the measured value and conversion coefficient to the same molecular object.
A buffer blank does not automatically remove the dye contribution
A matched blank accounts for background from the buffer and related components. The label is part of the sample and is absent from the buffer blank. If it absorbs at 260 nm, converting all of the total A260 as though it came from unlabeled nucleic acid also counts the dye signal. Contributions differ among dyes; neither color nor a single fixed deduction percentage works for all probes.
Here, fluorescently labeled nucleic acid means DNA or RNA with an attached fluorophore, such as a synthetic probe or a purified labeling product. It is distinct from adding a nucleic-acid-binding dye to a sample for fluorescence quantification. The measurement discussed here is absorbance, not fluorescence intensity.
Distinguish the two calculation routes
For a synthetic probe with a known sequence and labeling composition, one may use the supplier-confirmed molar extinction coefficient at 260 nm for the complete labeled molecule, εtotal: cstock = D × A260 ÷ (εtotal × l). D is the dilution factor and l is the pathlength in cm; εtotal is in M⁻¹·cm⁻¹ and the concentration is in mol/L. Confirm that the coefficient includes all dyes and other absorbing groups; do not infer this from its name. To calculate molar concentration of whole probes, the coefficient must be defined per mole of complete molecules; a per-base coefficient cannot be used directly as the whole-probe coefficient.
The other route first subtracts the dye contribution to A260 and then uses the coefficient for the nucleic acid component. These routes address the same kind of contribution using different inputs. Do not divide an absorbance already corrected for the dye by a total coefficient that includes that same dye contribution: this would correct twice.
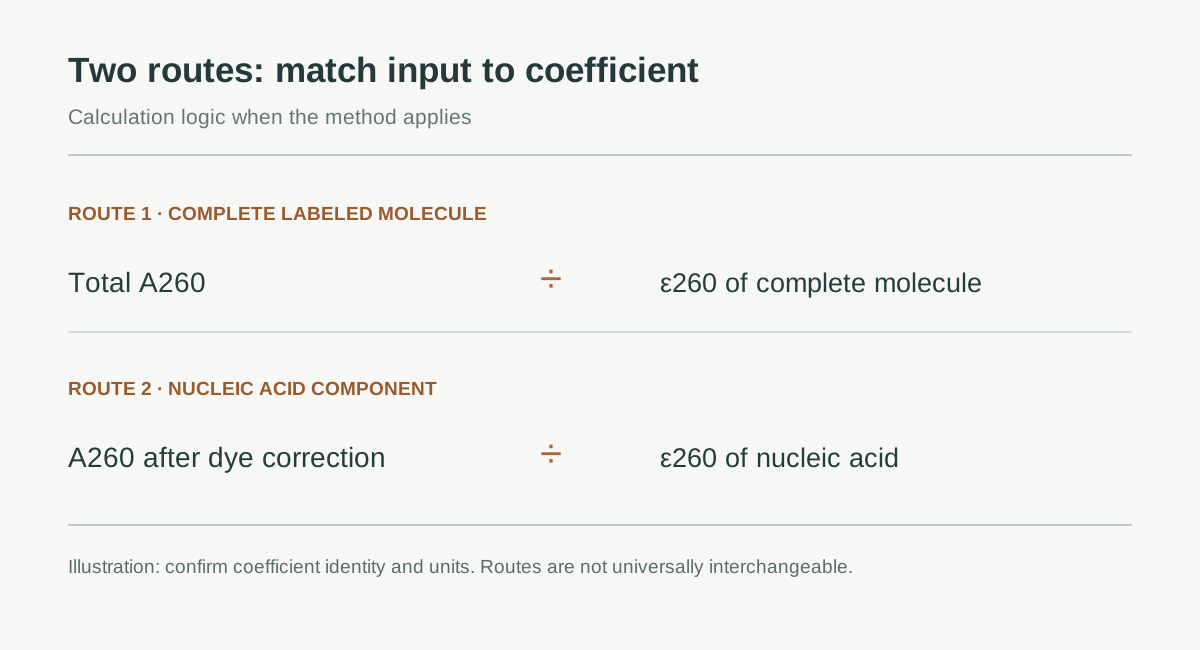
Figure 1. Each input must be paired with its corresponding coefficient. This illustrates calculation logic, not physical dye removal; the routes are not necessarily interchangeable for every sample.
What is needed for a single-dye correction?
When the method applies and other absorbance at the dye wavelength is negligible, the following expression estimates the dye contribution at 260 nm. Adye is absorbance at the specified dye wavelength, not a fluorescence reading. CF260 is the method-defined ratio of the dye’s own absorbance at 260 nm to its absorbance at the specified dye wavelength; it is dimensionless.
Nucleic acid absorbance = A260 − CF260 × absorbance at the dye wavelength
Both absorbances should come from the same diluted sample, use matched background correction, and refer to the same pathlength. In particular, determine whether exported values are actual short-path absorbances or 1 cm equivalent values; do not mix them. If using 1 cm equivalent absorbance, do not divide by the actual short pathlength again.
The following is a mathematical illustration, not an instrument measurement or recommended setting for any dye. Suppose the 1 cm equivalent A260 is 0.500, Adye is 0.400, and the applicable method specifies CF260 = 0.25. The estimated dye contribution is 0.100 and the nucleic acid contribution is 0.400.
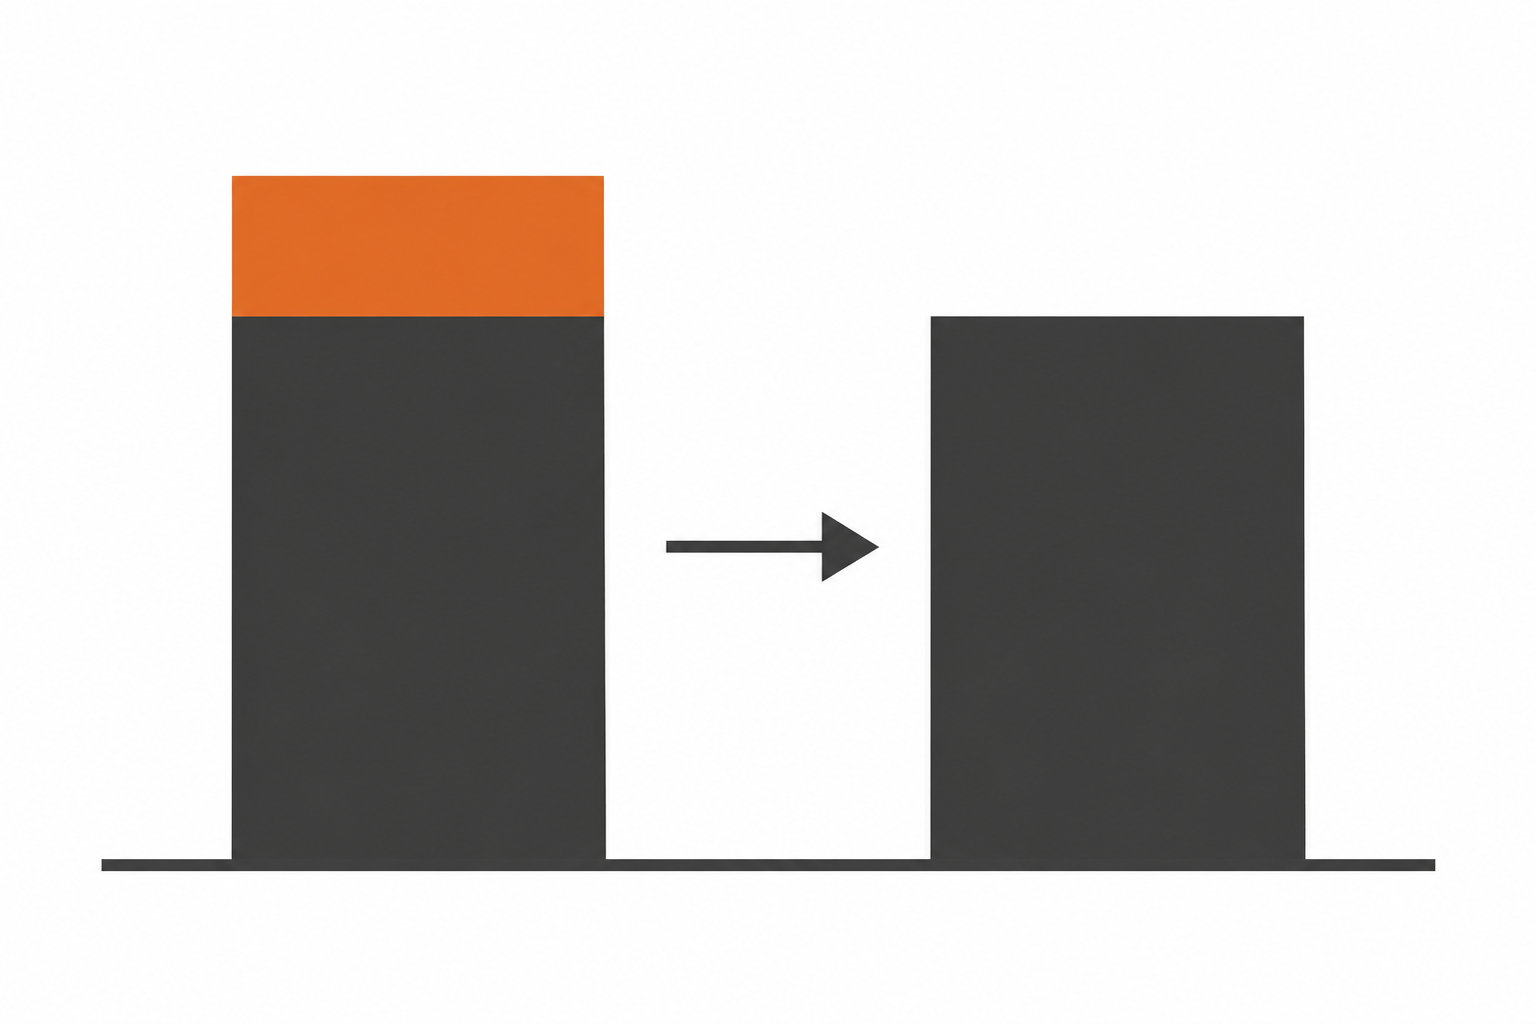
Figure 2. Decomposition in the teaching example: gray represents the nucleic acid contribution and orange the dye contribution. This is not a real spectrum or experimental result.
Now suppose ε260 for the nucleic acid component is 200,000 M⁻¹·cm⁻¹ and the sample was diluted 10-fold before measurement. Stock concentration = 10 × 0.400 ÷ (200,000 × 1) = 0.000020 M = 20 μM. If all of 0.500 were incorrectly attributed to nucleic acid, the result would be 25 μM, 25% higher than the corrected result. This percentage applies only to this example.
One dye factor cannot be generalized to every probe
Consult the relevant certificate of analysis, technical information, or validated method. Check the exact chemical form of the dye, analysis wavelength, coefficient definition, and solution conditions. Similar product names or colors do not establish that parameters are interchangeable. For short oligonucleotides, use a nucleic acid coefficient appropriate to the sequence and modifications rather than the average conversion for long DNA fragments.
A dual-labeled probe can carry both a fluorophore and a quencher. If both contribute UV absorbance, subtracting one dye cannot account for the whole system. Where component absorption spectra overlap at the analysis wavelengths, two peaks cannot simply be treated as pure dye signals. Prefer a supplier-provided coefficient for the complete probe or a validated multicomponent algorithm; do not decompose concentrations from two peaks alone.
Investigate abnormal results rather than forcing them to zero
If the corrected value is negative or close to zero, recheck the blank, wavelengths, pathlength, dilution record, factor direction, and whether software has already applied a correction. Subtracting two large quantities to obtain a small remainder makes input errors more consequential. Do not change a negative value to zero and declare that the sample contains no nucleic acid. If needed, remeasure within the valid range of the method and retain the original spectrum.
Dye correction is not purification. Free dye, unreacted labeling reagents, or other absorbing contaminants require an assessment of purification and quality control. Subtraction alone cannot establish that the measured material consists entirely of intact, correctly labeled probe. An expected concentration also does not replace verification of probe purity, labeling status, or downstream function.
Make the result traceable
Retain the sample sequence or lot, all labels, calculation route, coefficient source and units, original absorbances and their pathlength, blank composition, dilution factor, software corrections, and final value used. Recording exactly what is being calculated supports review better than a concentration number alone.
Related applications
Evolstorm’s microvolume analysis resources consider the full process from measurement to interpretation. When assessing a labeled nucleic acid workflow, check whether the wavelength, data export, and calculation method are suitable. This is general method guidance; it does not establish that NANO X1 has dye correction, compatibility with a particular probe, or automatic spectral separation. Such capabilities must be confirmed for the relevant model and software version.