
How to Choose a Protein Standard for Bradford Quantification
The standard curve looks good and replicate wells agree, yet the protein concentration differs substantially from the result of another method. In this situation, do not suspect only pipetting or the instrument. Also ask whether the protein used to construct the curve and the protein in the sample have the same color response. This article focuses on choosing a protein standard for the Bradford dye-binding assay and explains why stable measurements do not necessarily mean accurate measurements.
Color response is not a direct measurement of mass
The Bradford assay produces color through the interaction of protein with Coomassie Brilliant Blue dye. Absorbance is commonly read at 595 nm and compared with protein standards of known concentration. Proteins differ in composition and structure, so equal mass concentrations do not necessarily produce equal responses. A BSA (bovine serum albumin) curve therefore provides, first and foremost, a concentration estimate relative to the BSA standard, not a mass scale valid for every protein.
This does not mean that BSA should not be used. It is readily available, relatively well standardized, and suitable for many routine total-protein estimates. The concern is treating the widespread use of BSA as evidence that no sample has systematic bias. When the protein type changes or the major components change during purification, an approximation that was previously acceptable may no longer apply.
The same absorbance may correspond to different concentrations
To understand the direction of bias, first consider a simplified local linear model: the blank-subtracted signal is A = k × c, where k is the response slope for that protein under the current conditions. If the target protein has only 60% of the response slope of the standard protein, a true concentration of 0.80 mg/mL produces a signal of only 0.48. Reading this signal against a standard curve with a slope of 1.00 gives 0.48 mg/mL.
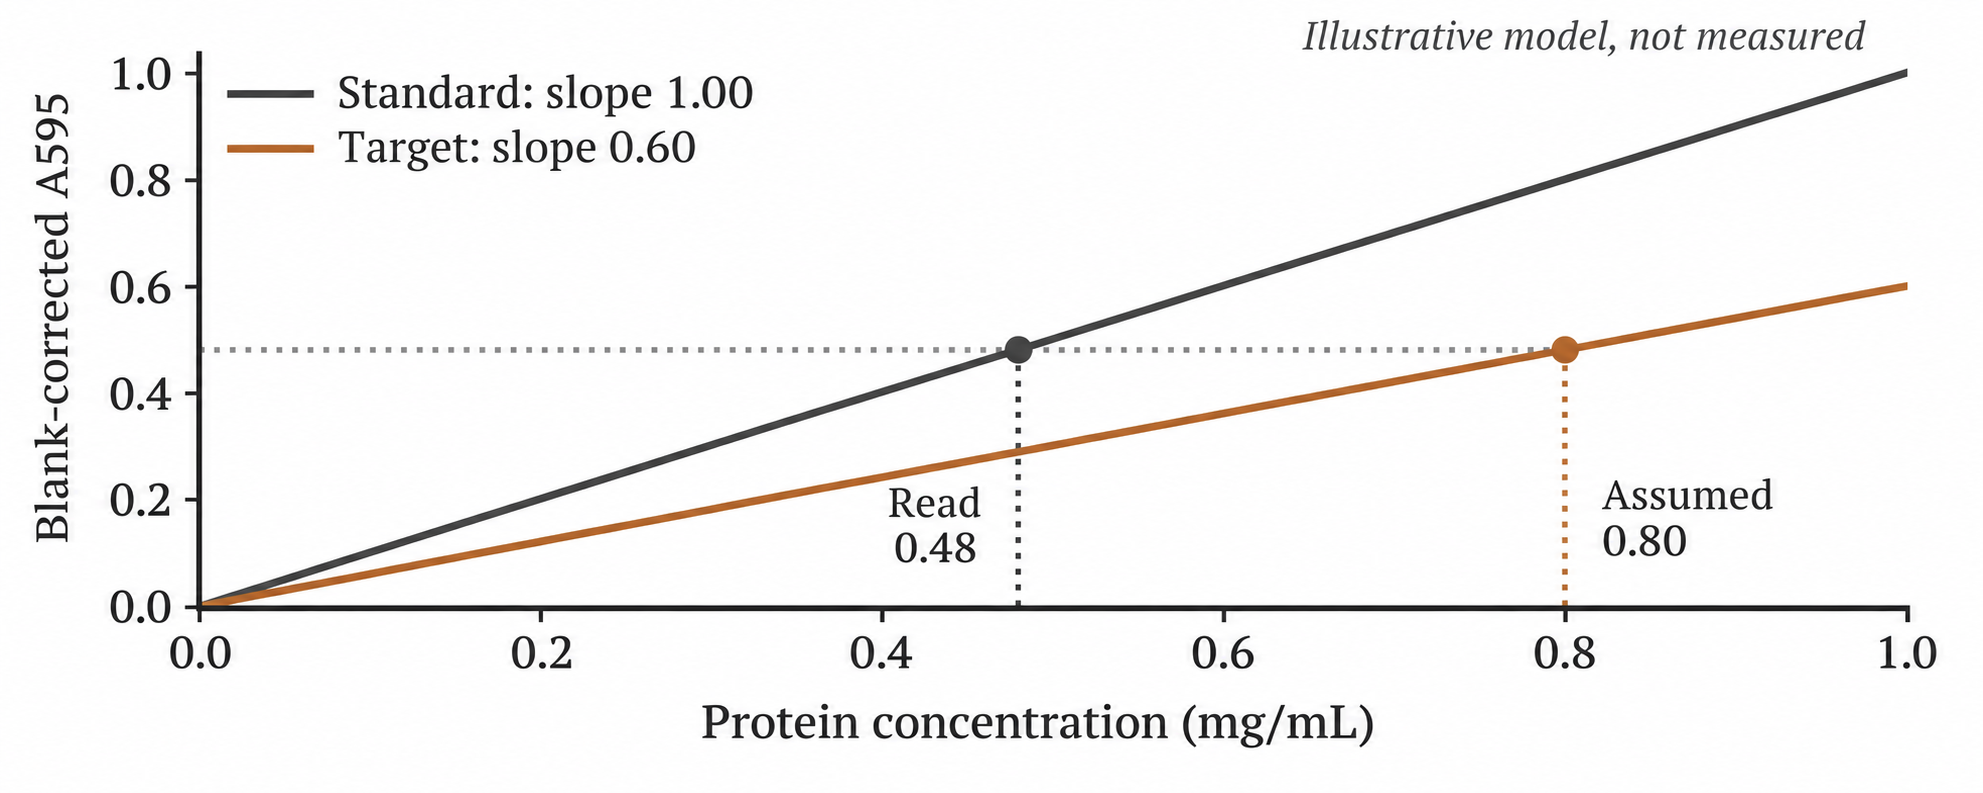
Figure 1. Original mathematical schematic, not measured data. Slope units are mL/mg, and the values are for illustration only: a target protein with a weaker color response is underestimated when read against a standard curve with a higher response. 0–1 mg/mL is not a recommended range for any assay kit.
Actual Bradford curves often show curvature. The straight lines above explain the principle and do not imply that a linear fit should be forced across the entire range. In practice, use the curve, range, and blank treatment permitted by the chosen reagent method. The 60% in this example is not a universal conversion factor between BSA and any particular protein.
Choose the standard according to the experimental purpose
To assign a mass concentration to a purified single protein as accurately as possible, first consider using the same protein as a standard, with suitable purity and a concentration independently established by a reliable method. Do not assign a concentration to the target protein using a BSA curve and then treat that protein as independent evidence that the BSA result is correct. That simply carries the same bias into the new standard.
If a standard of the same protein is unavailable, a substitute with similar color-response behavior can be evaluated. For example, manufacturers often suggest bovine γ-globulin (BGG) as a candidate standard for immunoglobulin samples. This does not mean that one correction ratio can be applied directly to every antibody. A substitute standard still requires validation for the specific reagent, sample, and required accuracy.
For routine loading normalization of similar cell lysates, consistently using BSA may be a practical choice, provided that sample composition and buffer conditions are also controlled. If a treatment causes extensive protein degradation, substantial enrichment of one component, or a change in sample category, identical reported values do not automatically establish equal true total mass. For complex mixtures, reporting a “total-protein estimate using BSA as the standard” is more traceable than omitting the identity of the standard.
Dilution agreement cannot exclude a mismatch between standard and sample
Dilution checks are useful, but they do not solve every problem. Using the model in Figure 1 again, a 2-fold dilution reduces the true sample concentration to 0.40 mg/mL and gives a reading of 0.24 mg/mL; multiplying by 2 still gives 0.48 mg/mL. A 4-fold dilution also returns the same incorrect result. As long as the response ratio stays constant, systematic bias can coexist with good agreement after dilution correction.
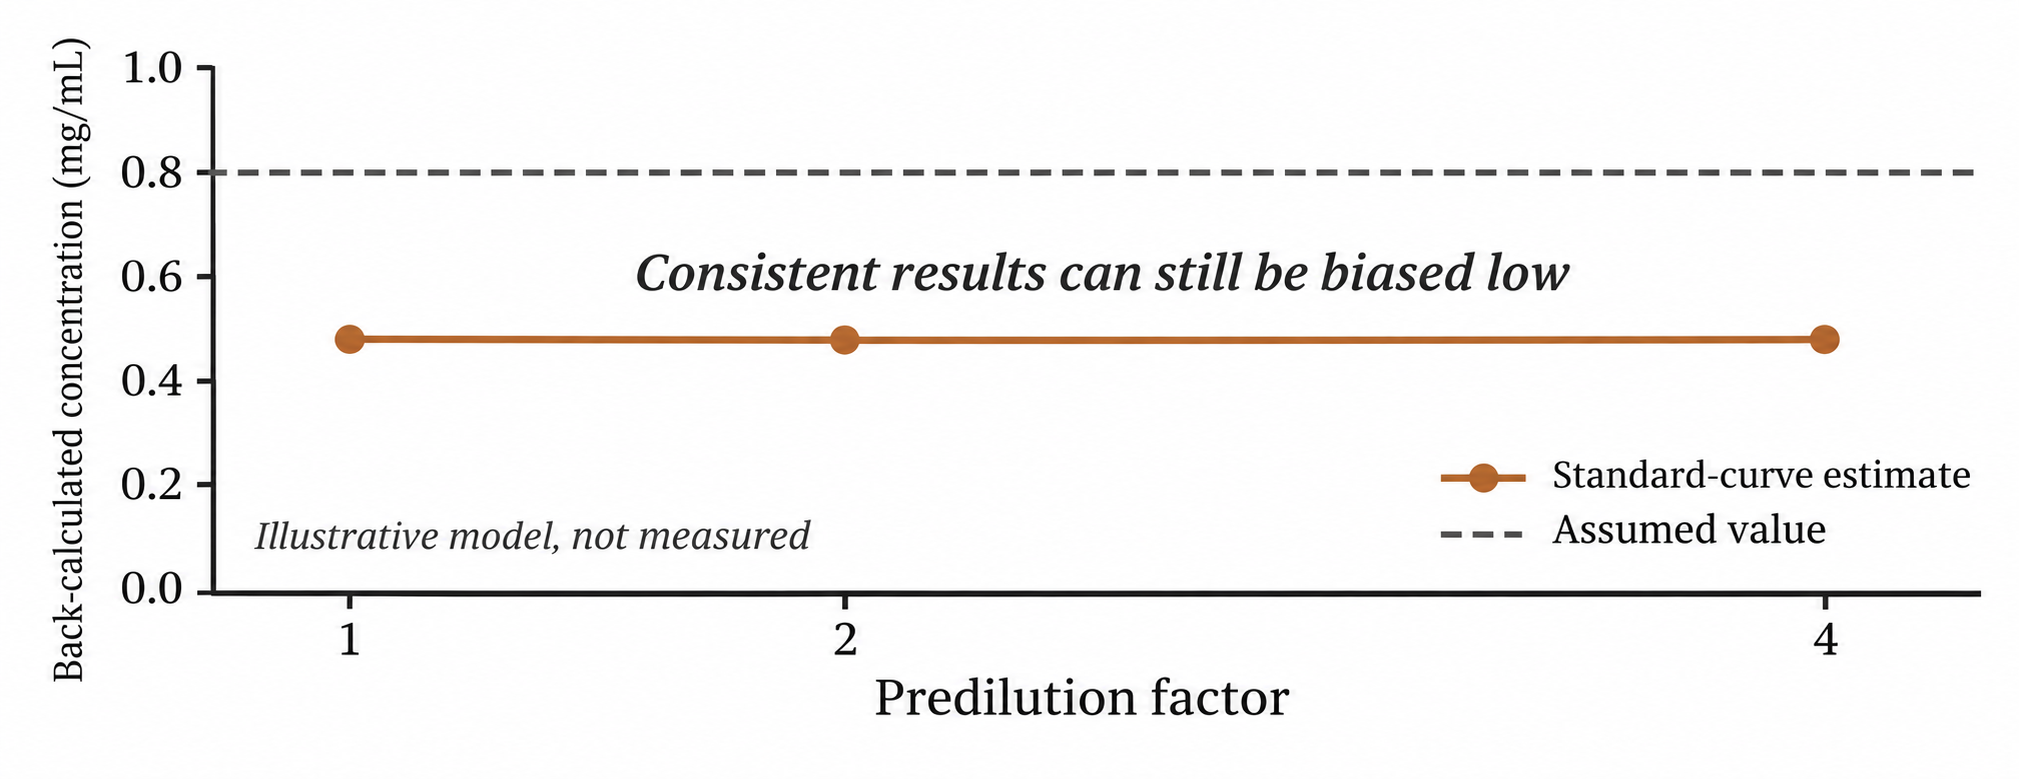
Figure 2. Original teaching model, not experimental data. All dilution points are assumed to lie within the valid measurement range, with no matrix interference. Agreement after back-calculation shows that this model is internally consistent, but does not establish that the standard and target protein have the same response.
Thus, disagreement after dilution requires investigation, whereas agreement is only supporting evidence and cannot alone serve as acceptance of accuracy. Repeated measurements also primarily help assess variability; they cannot by themselves identify a fixed proportional bias.
Investigate protein differences separately from buffer interference
A low response may arise from the protein itself or from detergents, other additives, turbidity, or precipitates in the sample. These causes should not be conflated. Changing the protein standard does not automatically eliminate matrix interference, and placing the standard in the same buffer does not ensure identical color responses from different proteins.
For troubleshooting, first keep the reagent and measurement format fixed. Put standards and samples in diluent conditions that are as similar as possible, react them in the same batch, handle them identically, and inspect the reagent blank and sample appearance. Choose several dilution points within the valid range and check the back-calculated trend. Compatibility tables must match the specific reagent formulation and experimental conditions; do not apply a concentration permitted by one manufacturer directly to another Bradford reagent.
Once matrix effects have been controlled, consider a standard of the same protein or an independent quantification method if the result will be used for protein yield, preparation at specified molar ratios, specific activity, or other calculations sensitive to the denominator. For a purified protein of known composition, an A280 cross-check using a reliable sequence-dependent extinction coefficient may be considered. However, nucleic acid contamination, scattering, absorbing prosthetic groups, or an unsuitable buffer may also distort A280. Disagreement between two methods does not mean that either one must be correct.
Manufacturer response tables are not universal correction tables
For example, The Thermo Scientific Pierce Bradford assay kit instructions MAN0011181 C.0, Table 3, report responses of different proteins relative to BSA at 1000 μg/mL under specific standard test-tube conditions. Such data demonstrate that differences between proteins exist, but are not a universal correction table across brands, concentrations, or batches. This article does not present those values as Evolstorm measurements or use them to assign correction factors to unknown samples.
Deliver concentration results together with their conditions of applicability
Record the name and lot of the protein standard, the source of its assigned concentration, the reagent name and version, the sample matrix, reaction and reading conditions, curve range and fitting method, dilution factor, and final concentration units. If response matching between standard and sample has not been validated, retain that limitation in the result rather than masking it with more decimal places.
Evolstorm’s technical content aims to help laboratories move from obtaining a number to understanding which conclusions that number supports. For specific devices such as NANO X1, the Bradford measurement mode, vessel, reagent compatibility, and data processing must still be verified against the relevant version of the documentation. This article explains general quantification principles and is not an unvalidated product operating guide.