
Buffer interference in BCA protein quantitation and how to investigate it
The same protein sample gives a substantially different BCA concentration after a change of buffer, or a protein-free buffer turns purple when the working reagent is added. In these situations, check the reducing agents, metal chelators, and other additives in the sample, as well as pipetting and the instrument.
A BCA reading comes from a color-development reaction. A buffer can increase background or alter the protein's color response. A matched blank is a necessary control, but it does not guarantee that all interference will be removed. This article discusses the conventional purple BCA assay measured at 562 nm; follow the respective instructions for other modified formulations.
1 Why buffers can affect color development
Under alkaline conditions, protein participates in reducing divalent copper, Cu²⁺, to monovalent copper, Cu⁺. Two BCA molecules then form a purple complex with one Cu⁺ ion, and protein concentration is estimated from absorbance and a standard curve.
This reaction pathway also creates opportunities for interference. Buffer components that reduce copper can produce color that does not come from protein. Components that bind copper or alter the reaction conditions can also change the extent of protein-dependent color development.
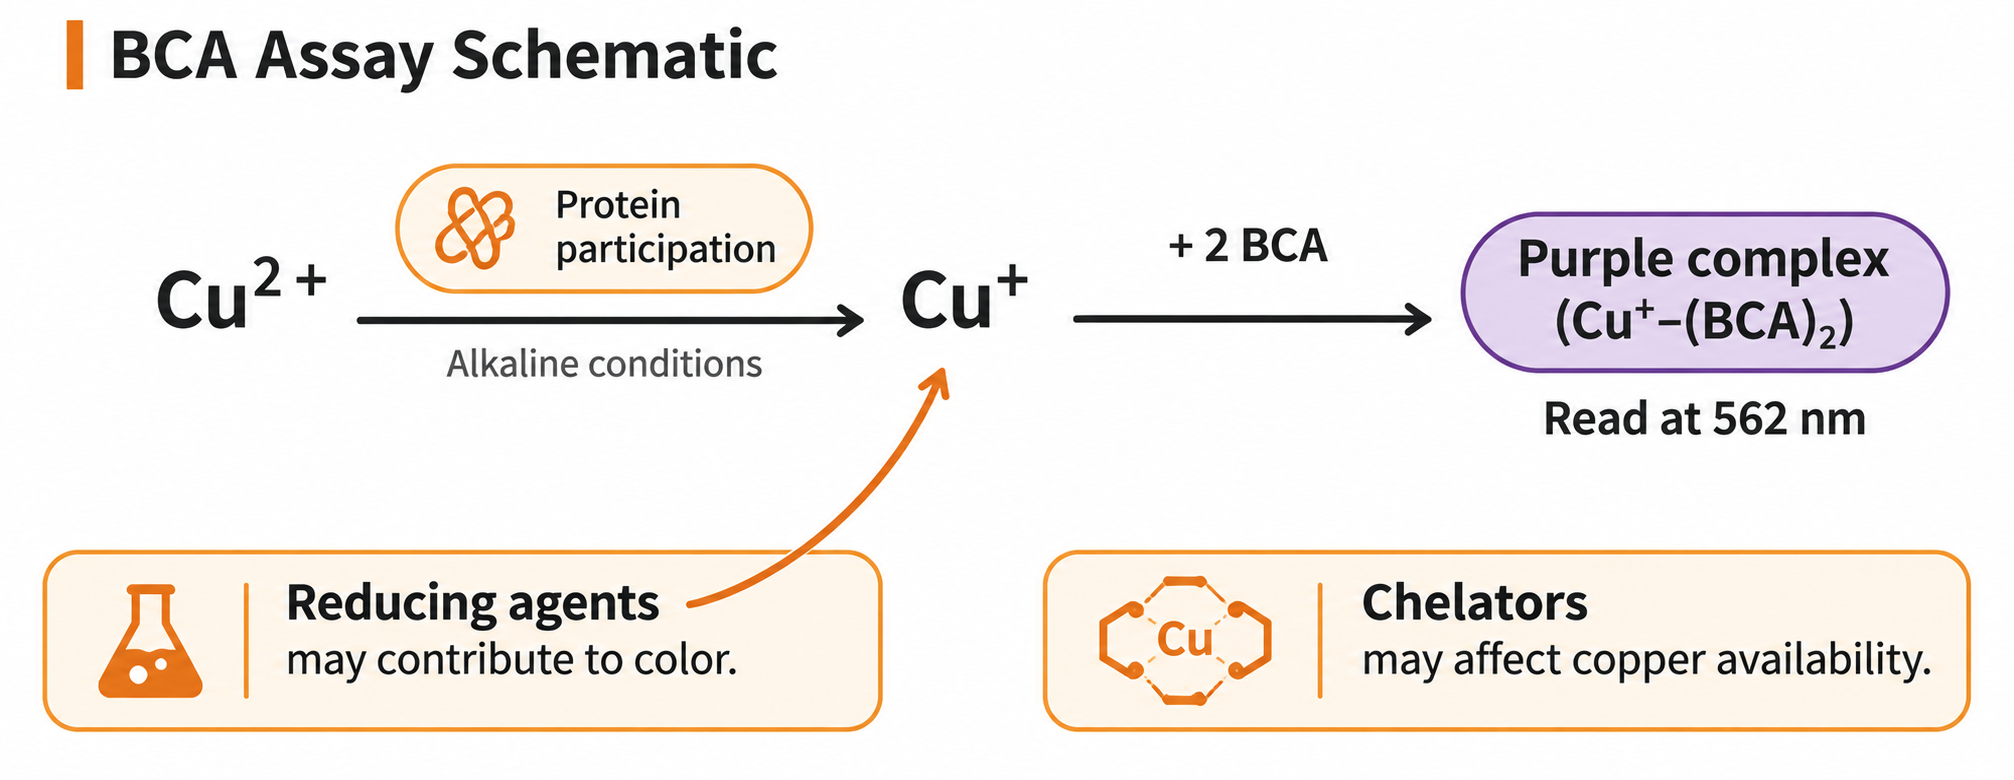
Figure 1. The conventional BCA color-development pathway and possible points of interference. This schematic illustrates the principle, not specific reaction rates or interference magnitudes.
A higher reading therefore does not necessarily mean more protein, and a lower reading cannot be attributed solely to protein loss. Color intensity alone cannot distinguish protein signal from chemical interference.
2 Check these three groups of components first
Reducing agents. DTT, β-mercaptoethanol, and similar substances can interfere with conventional BCA reactions, even producing substantial color in the absence of protein. Record the specific substance and its actual concentration rather than simply noting that a reducing agent was added. Even with a formulation labeled as reducing-agent compatible, check which substances, concentrations, and operating conditions that claim covers.
Metal chelators. Components such as EDTA can affect copper's participation in the reaction and thus alter color development. This does not justify a blanket conclusion that BCA cannot be used whenever EDTA is present. The effect depends on concentration, reagent formulation, and the sample-to-working-reagent ratio; consult the compatibility information for the particular method.
Other additives and complex matrices. Detergents, sugars, strong acids and bases, and multicomponent lysis buffers or culture media all require individual consideration. Some BCA formulations tolerate certain detergents well, but that does not establish suitability at any concentration or in any mixture. Keeping each component below an individual limit does not replace validation of the complete sample matrix.
3 Check how concentrations are defined in a compatibility table
Before using a compatibility table, confirm four things: the reagent name and version, whether the method uses tubes or a microplate, the sample-to-working-reagent ratio, and whether the listed concentration refers to the sample before working reagent is added or to the final reaction mixture.
If a limit is specified as the concentration in the protein sample, compare it with the sample actually added to the reaction. Do not first divide that concentration by the dilution factor introduced when the reaction is mixed and then assess compatibility; that would count the same dilution twice.
Compatibility tables usually also specify the test protein, protein concentration, and permitted deviation. They help screen methods but do not automatically provide acceptance criteria for your experiment. Additional experimental verification is particularly important at low protein concentrations or with complex mixed matrices.
4 Why blank subtraction may still leave an inaccurate result
If standards are prepared in water but samples contain buffer additives, their color-development environments differ. When a suitable protein-free matrix is available, keep the relevant buffer components consistent in the blank, every standard point, and the unknown samples, and process them in the same way. Do not allow interferent concentrations to change along with the protein standard series as standards are diluted.
Blank subtraction mainly addresses differences in background. If color development in the presence of both protein and interferent is not simply the sum of their separate responses, subtracting the protein-free buffer reading can still leave a bias. Conversely, a blank with no obvious color does not rule out suppression of protein-dependent color development by the matrix.
Interpret the blank together with evidence such as consistency across dilutions and spike recovery. Repeatedly zeroing the instrument cannot correct incompatibility within the reaction mixture.
5 Dilution must account for both the interferent and the protein
Dilution can reduce interferent concentration, but it also reduces protein concentration. The diluent must be suitable for the sample and must not reintroduce the interferent being reduced. Diluting with a buffer that contains the same high concentration of DTT, for example, will not reduce the DTT concentration in proportion to the dilution factor.
For example, suppose a sample contains 0.80 mg/mL protein and 2.0 mM DTT. After a 4-fold predilution with a suitable DTT-free diluent, these become 0.20 mg/mL and 0.50 mM respectively. Here 4-fold means taking 1 part sample and making up to 4 parts total volume. This is only a dilution calculation; 0.50 mM is not a compatibility limit recommended by this article.
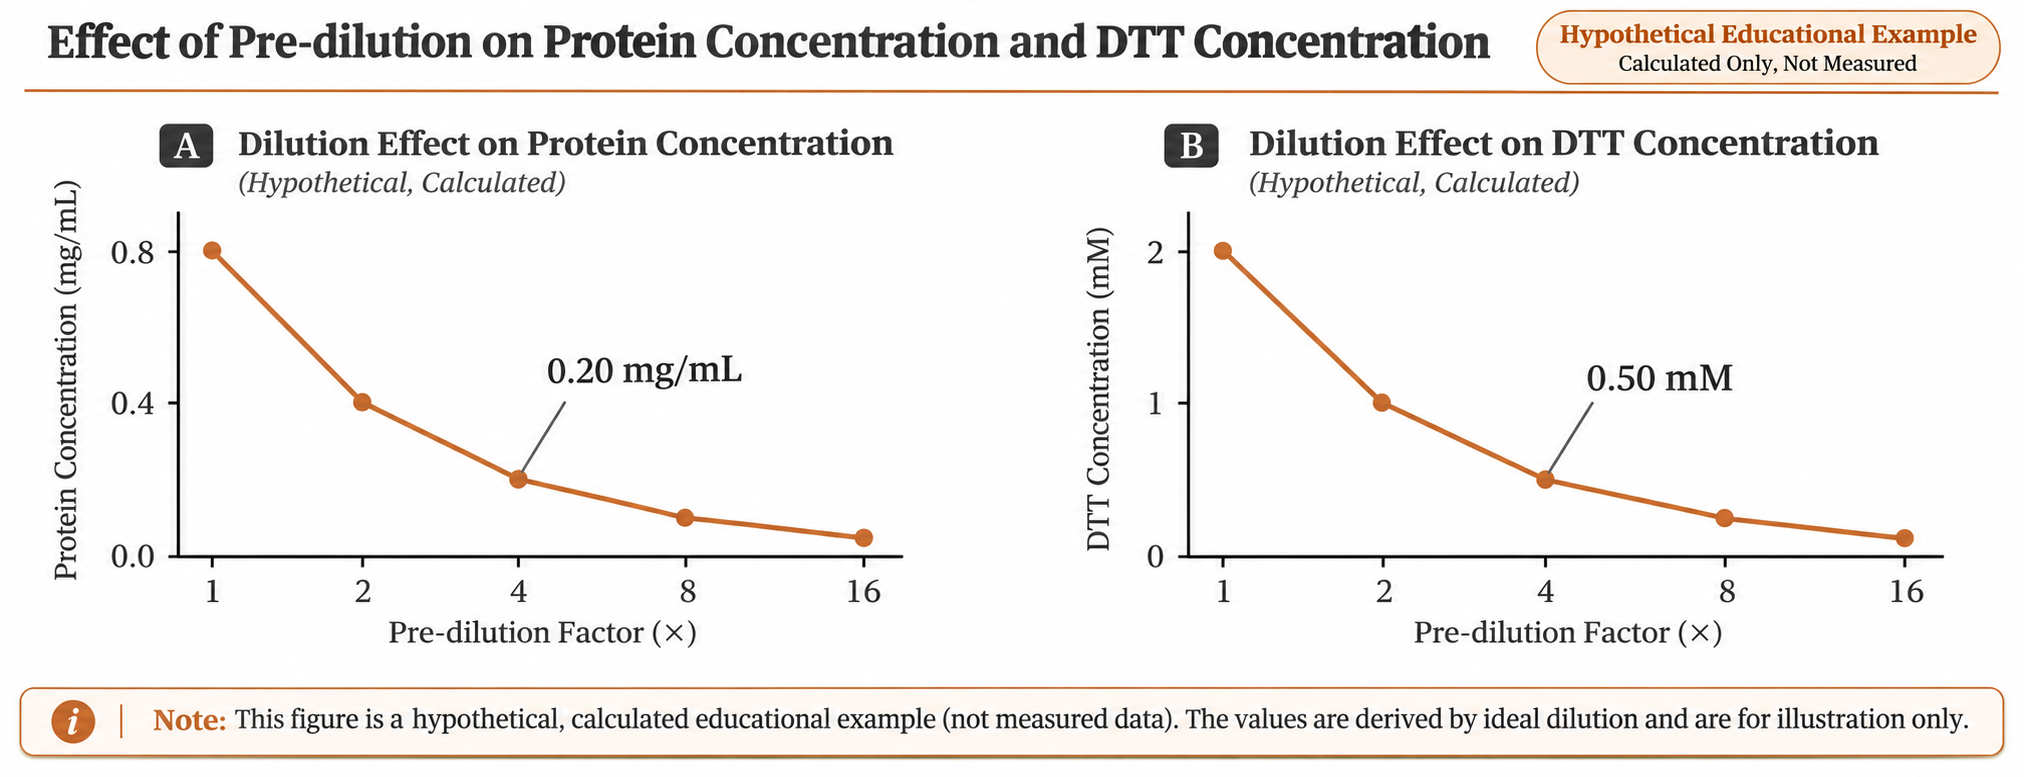
Figure 2. Predilution reduces both protein and DTT concentrations. Values are calculated from an initial protein concentration of 0.80 mg/mL and DTT concentration of 2.0 mM, using a DTT-free diluent. The points are calculated values, not measurements, and do not indicate compatibility limits or a valid quantitation range.
Whether this factor is suitable depends on meeting all of the following conditions: the interferent falls to a level acceptable for the method, protein remains within the validated quantitation range, and dilution does not cause precipitation or substantial sample loss. If there is no usable overlap between these requirements, increasing the dilution factor is not an adequate solution.
When comparing predilution conditions, first multiply concentrations obtained within the valid range by their respective predilution factors, then compare the results for the original sample. If the standard curve was constructed using standard concentrations before working reagent was added, do not apply an additional factor for the dilution caused by adding the working reagent.
6 Use a small verification study to choose the next step
First, record the full formulation. Document the lysis or elution buffer, additives introduced shortly before measurement, final concentrations, reagent lot, sample-to-working-reagent ratio, incubation temperature, and reading time. Process standards and samples together, as BCA color development varies with conditions and time.
Next, include informative controls. Within the method's applicable conditions, compare a matrix-matched reaction blank, a known protein control, and two or more predilutions of the same sample. Include independently prepared reaction replicates for each condition, rather than merely reading the same reaction mixture repeatedly.
Check spike recovery where needed. Add a known amount of an appropriate protein standard to the sample, then compare the increase measured after spiking with the theoretical amount added. Account for the volume change caused by spiking before calculating recovery, and keep the two matrices as similar as possible. Define the acceptable recovery range in advance according to the experimental purpose and method validation, rather than adopting a universal percentage.
Agreement between original-sample concentrations calculated from different dilutions is useful supporting evidence, but it cannot independently establish accuracy. Acceptable BSA spike recovery also does not guarantee that all proteins in the sample respond like BSA. If the spike is added after sample preparation, it cannot assess protein lost earlier in that preparation. When higher accuracy is required, suitable reference materials or an independent method can provide additional verification.
If interference remains uncontrolled, consider validated buffer exchange, desalting, or precipitation, or choose a quantitation method better suited to the matrix. Sample preparation can cause protein loss, so recovery must be checked. Switching to Bradford also requires a fresh assessment of detergent compatibility and differences in protein response; changing methods does not automatically remove interference.
Related products and applications
The Evolstorm NANO X1 platform lists protein colorimetric methods including BCA-562, Bradford, and Lowry-650. When selecting a method, first document sample composition, expected concentration, and reagent conditions, then check the applicable requirements for the instrument configuration and software version.
Whatever platform is used to read the reaction, a reliable BCA result depends on a compatible reaction mixture, suitable standards, and appropriate controls. The instrument measures absorbance; the experimental design determines whether that signal can represent the protein concentration of the target sample.