
How to Select the Slope and Pathlength When Calculating Enzyme Activity from A340
Fitting the first minute or all five minutes of the same NADH reaction curve may give different enzyme activity results. The formula is not necessarily the problem: mixing after reagent addition, slowing in the later stages of the reaction, and uncorrected background changes may all be included in the slope. This article discusses continuous absorbance assays that use NADH consumption as the indicator signal. It explains how to convert a time course into an enzyme activity result with clearly defined conditions, rather than treating the difference between any two points as the initial rate.
First establish which change is being measured
NADH absorbs strongly at 340 nm. For example, when lactate dehydrogenase catalyzes the reduction of pyruvate, A340 decreases over time as NADH is oxidized. To use this change to represent the rate of the target reaction, confirm the reaction stoichiometry, absorption or scattering from other components, and whether background reactions occur independently of the target enzyme. A decrease in A340 in a complex sample does not inherently arise only from the target enzyme.
The focus here is the rate under specified assay conditions, not the total amount of NADH ultimately consumed. Comparing enzyme activities also requires identical or demonstrably comparable temperature, pH, substrate, and cofactor conditions. In a coupled assay, separately verify that the indicator reaction does not become rate-limiting; a declining curve alone does not establish that the coupled system is responding adequately.
The initial rate is not simply the first two points
First inspect the complete time course to identify abrupt changes caused by sample addition and mixing, then look for an early reaction interval with an approximately stable slope. Fit multiple time points and examine deviations on either side of the fitted line for systematic curvature; a high R² alone does not establish that the interval is suitable. If moving the interval slightly earlier or later changes the result substantially, investigate the cause instead of selecting the interval that gives the highest enzyme activity.
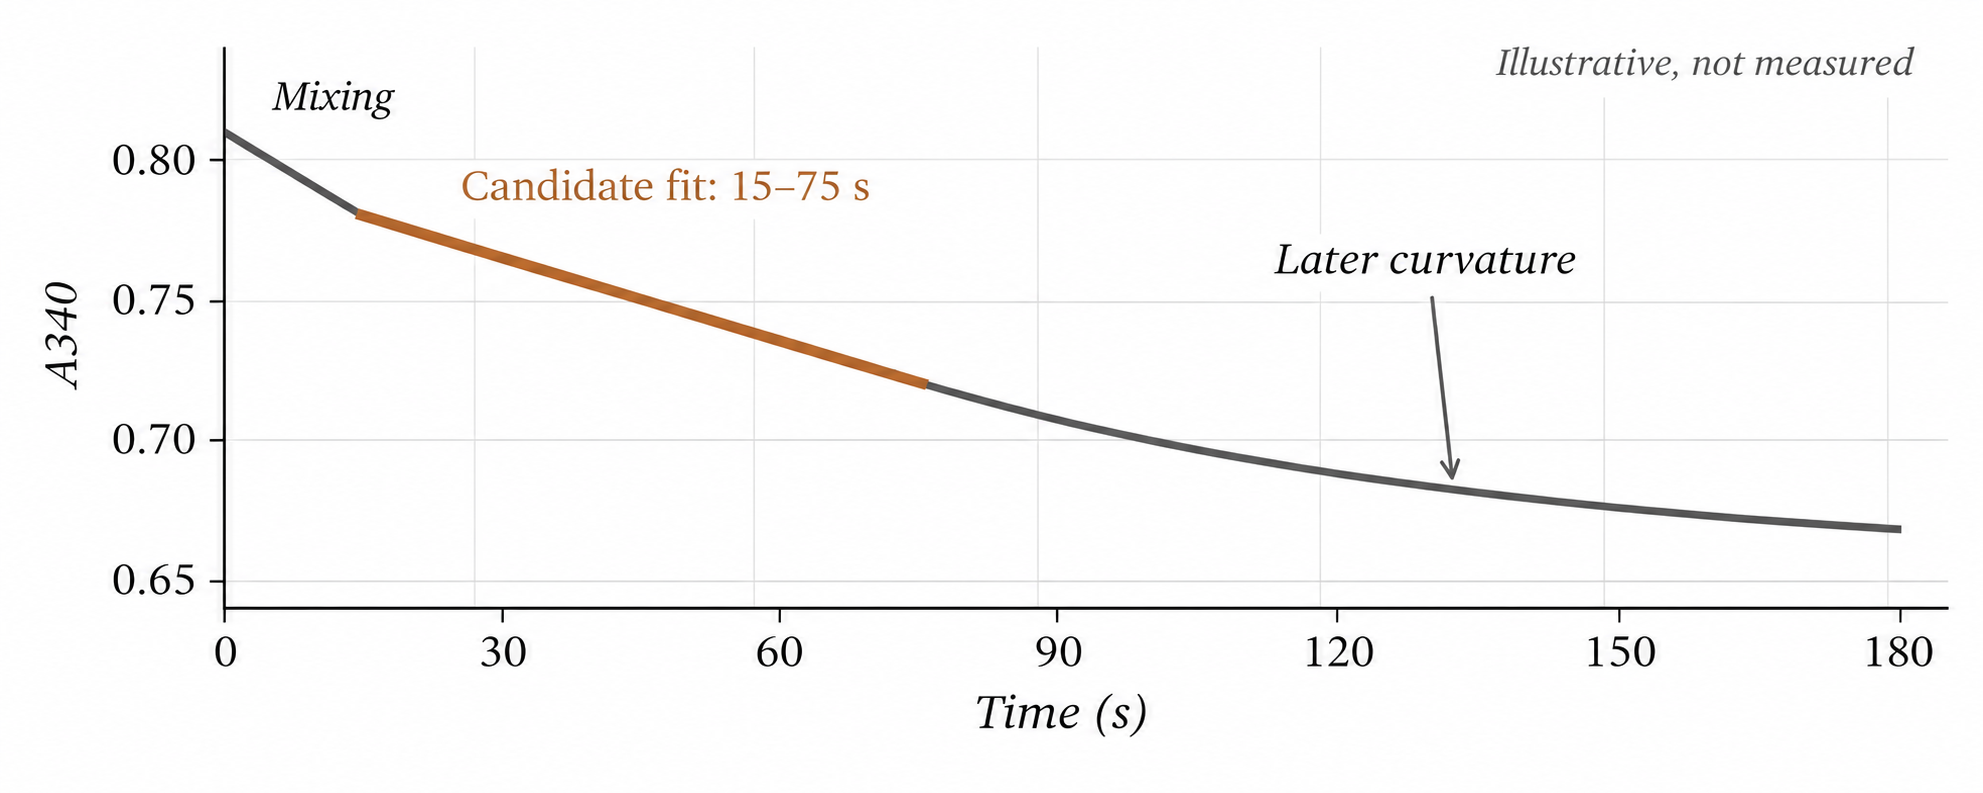
Figure 1. Original teaching schematic, not experimental data. Orange indicates only a candidate fitting interval; 15–75 s is not a universally recommended interval. The mixing phase and later curvature should not be included in an initial linear rate without evaluation.
If the reaction has already slowed substantially by the time mixing is complete, adding more sampling points cannot recover the initial phase that has been missed. Where the method permits, reduce the amount of enzyme or improve coordination between mixing and the start of data acquisition, then validate the new measurement window. If there is no suitable linear interval, do not force a linear initial-rate result. Re-optimize the conditions or use a validated curve-analysis method appropriate to the reaction mechanism.
Subtract the background change before calculating enzyme activity
Establishing an absorbance baseline with an instrument reference and measuring the time-dependent change in a reaction blank are two different steps. The former cannot replace the latter. The reaction blank should retain the matrix and reagents of the actual system as far as possible, removing or replacing only the component that triggers the target reaction as required by the method, while keeping the volume unchanged. No single blank formulation suits every enzyme system.
Retain the sign of each slope during calculation. Let the fitted slope of the reaction mixture be s_test and that of the reaction blank be s_blank, both in A/min. For a reaction expected to consume NADH, define the absorbance-change rate corresponding to positive consumption as rA:
rA = −(s_test − s_blank)
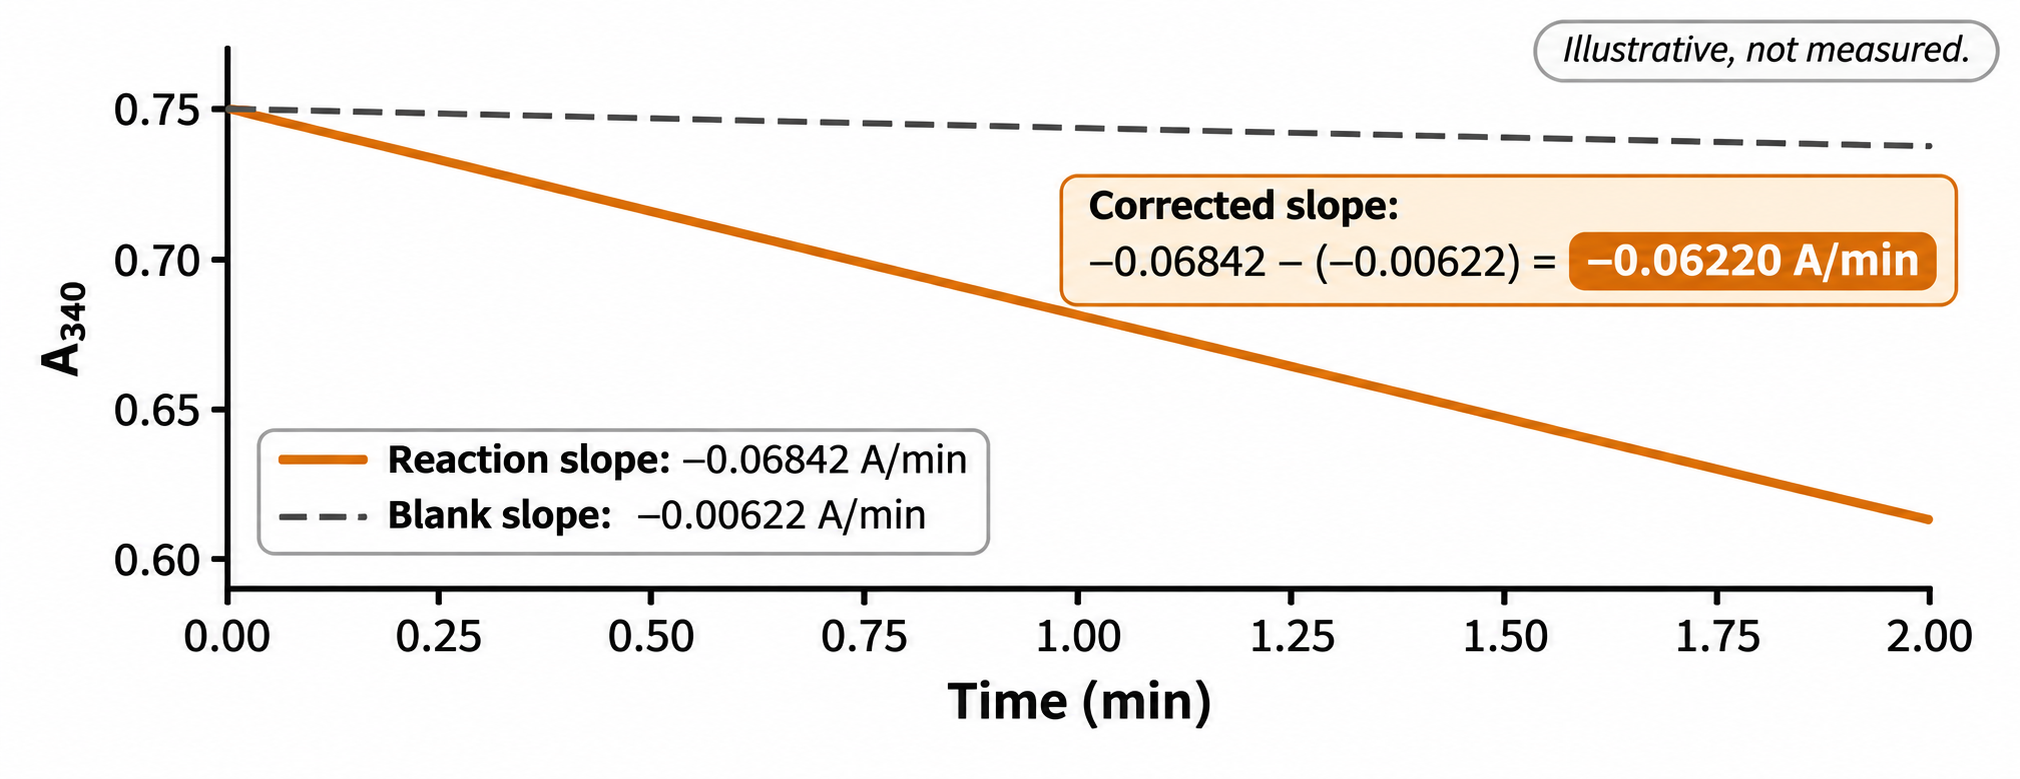
Figure 2. Original mathematical example, not measured data. The two lines have the same starting absorbance to aid comparison. Subtracting the blank slope from the test slope gives −0.06220 A/min; NADH consumption corresponds to rA = 0.06220 A/min.
If the direction after subtraction is opposite to that expected, do not simply take the absolute value and turn an anomaly into “positive enzyme activity.” Check the blank, sample addition, and reaction direction. Subtracting a single blank slope may also be insufficient when the background is markedly nonlinear or interacts with the sample.
Pathlength and volumes must correspond to the current data
Provided that NADH and the target reaction have a 1∶1 stoichiometric relationship and the absorbance relationship is linear, the activity concentration of the original enzyme stock can be calculated as follows. U denotes the amount of enzyme that converts 1 μmol of substrate per minute under specified conditions:
Enzyme activity (U/mL) = rA × V_total × D ÷ (ε340 × l × V_enzyme)
Use the ε340 value specified by the method; 6.22 mM⁻¹·cm⁻¹ is commonly used for NADH assays. Express l in cm. V_total and V_enzyme are the total reaction volume and the volume of diluted enzyme sample added, respectively, both in mL. D refers only to the dilution factor applied to the enzyme sample before it is added to the reaction. If the reaction stoichiometry is not 1∶1, apply the corresponding stoichiometric correction.
Use a worked example to check units and avoid duplicate corrections
Assume that the net change in Figure 2 is 0.06220 A/min and that the absorbance corresponds to a 1.00 cm pathlength. The total reaction volume is 1.00 mL, and 0.050 mL of enzyme sample is added after a 10-fold dilution of the stock. With ε340 = 6.22 mM⁻¹·cm⁻¹, the rate of NADH consumption in the reaction mixture is 0.0100 mM/min, or 0.0100 μmol/(mL·min). Multiplying by the total volume gives an enzyme activity of 0.0100 U in the reaction. Dividing by 0.050 mL and multiplying by 10 then gives 2.00 U/mL for the stock. All values are assumptions for teaching purposes.
If the reaction conditions remain unchanged and only the actual pathlength changes from 1.00 cm to 0.50 cm, the net absorbance slope before pathlength normalization should halve, to approximately 0.03110 A/min. Using 0.50 cm in the calculation still gives 2.00 U/mL. If the software has already converted absorbance to a 1 cm equivalent, use 1 cm; do not divide again by the actual short pathlength. When the pathlength is unknown, do not insert a microplate or microvolume measurement slope directly into a formula for a 1 cm cuvette.
Time units can also cause errors in the order of magnitude. If the slope is in A/s, multiply by 60 to convert it to A/min; merely changing the unit label to “per minute” is not sufficient. Also check whether exported times are in seconds or minutes and whether the software has already subtracted the blank, normalized for pathlength, or corrected for dilution, so that no step is applied twice.
Do not copy measurement settings from a nucleic acid quantification template
In an NADH assay, 340 nm is the target signal wavelength and must not be subtracted as a baseline reference assumed to have no target absorption. If the method requires correction using two wavelengths, validate the reference wavelength against the spectra of the components rather than copying default settings for nucleic acid quantification. The vessel, evaporation control, mixing, temperature, and sampling interval for extended continuous measurement must also suit the reaction. An instrument’s ability to measure at 340 nm does not automatically establish a complete enzyme activity assay.
Retain conditions that allow the result to be checked
At a minimum, retain the original time course, reaction blank, fitting start and end times, slope and units, pathlength corresponding to the absorbance, total volume, enzyme sample volume, predilution factor, temperature, and pH. When reporting U/mL, specify whether the value refers to the stock or the diluted solution. When reporting U/mg, also specify whether the denominator is target enzyme protein or total protein. Keeping only one enzyme activity value often makes it impossible to determine why two results differ.
Evolstorm’s technical content focuses on traceability from optical signals to experimental conclusions. Before using a specific device, including NANO X1, verify the measurement modes, time recording, temperature-control configuration, and data processing for the model and software version concerned. This general method discussion does not replace a product manual or a validated enzyme activity assay procedure.